Androgen receptor-_target genes in african american prostate cancer disparities
- PMID: 23365759
- PMCID: PMC3556896
- DOI: 10.1155/2013/763569
Androgen receptor-_target genes in african american prostate cancer disparities
Abstract
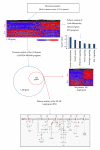
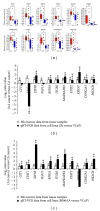
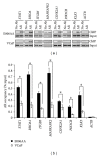
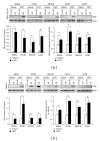
The incidence and mortality rates of prostate cancer (PCa) are higher in African American (AA) compared to Caucasian American (CA) men. To elucidate the molecular mechanisms underlying PCa disparities, we employed an integrative approach combining gene expression profiling and pathway and promoter analyses to investigate differential transcriptomes and deregulated signaling pathways in AA versus CA cancers. A comparison of AA and CA PCa specimens identified 1,188 differentially expressed genes. Interestingly, these transcriptional differences were overrepresented in signaling pathways that converged on the androgen receptor (AR), suggesting that the AR may be a unifying oncogenic theme in AA PCa. Gene promoter analysis revealed that 382 out of 1,188 genes contained cis-acting AR-binding sequences. Chromatin immunoprecipitation confirmed STAT1, RHOA, ITGB5, MAPKAPK2, CSNK2A,1 and PIK3CB genes as novel AR _targets in PCa disparities. Moreover, functional screens revealed that androgen-stimulated AR binding and upregulation of RHOA, ITGB5, and PIK3CB genes were associated with increased invasive activity of AA PCa cells, as siRNA-mediated knockdown of each gene caused a loss of androgen-stimulated invasion. In summation, our findings demonstrate that transcriptional changes have preferentially occurred in multiple signaling pathways converging ("transcriptional convergence") on AR signaling, thereby contributing to AR-_target gene activation and PCa aggressiveness in AAs.
Figures


Similar articles
-
Tumor suppressive miR-99b-5p as an epigenomic regulator mediating mTOR/AR/SMARCD1 signaling axis in aggressive prostate cancer.Front Oncol. 2023 Nov 7;13:1184186. doi: 10.3389/fonc.2023.1184186. eCollection 2023. Front Oncol. 2023. PMID: 38023145 Free PMC article.
-
Androgen receptor mutations and polymorphisms in African American prostate cancer.Int J Biol Sci. 2014 Jun 5;10(6):643-51. doi: 10.7150/ijbs.8974. eCollection 2014. Int J Biol Sci. 2014. PMID: 24948877 Free PMC article.
-
Psychosocial Stress, Glucocorticoid Signaling, and Prostate Cancer Health Disparities in African American Men.Cancer Health Disparities. 2020;4:https://companyofscientists.com/index.php/chd/article/view/169/188. Cancer Health Disparities. 2020. PMID: 35252767 Free PMC article.
-
Race-specific coregulatory and transcriptomic profiles associated with DNA methylation and androgen receptor in prostate cancer.Genome Med. 2024 Apr 2;16(1):52. doi: 10.1186/s13073-024-01323-6. Genome Med. 2024. PMID: 38566104 Free PMC article. Review.
-
Molecular mechanisms involving prostate cancer racial disparity.Am J Clin Exp Urol. 2017 Nov 9;5(3):34-48. eCollection 2017. Am J Clin Exp Urol. 2017. PMID: 29181436 Free PMC article. Review.
Cited by
-
The evolution and polymorphism of mono-amino acid repeats in androgen receptor and their regulatory role in health and disease.Front Med (Lausanne). 2022 Oct 20;9:1019803. doi: 10.3389/fmed.2022.1019803. eCollection 2022. Front Med (Lausanne). 2022. PMID: 36388907 Free PMC article. Review.
-
Tumor suppressive miR-99b-5p as an epigenomic regulator mediating mTOR/AR/SMARCD1 signaling axis in aggressive prostate cancer.Front Oncol. 2023 Nov 7;13:1184186. doi: 10.3389/fonc.2023.1184186. eCollection 2023. Front Oncol. 2023. PMID: 38023145 Free PMC article.
-
Genetic and biological drivers of prostate cancer disparities in Black men.Nat Rev Urol. 2024 May;21(5):274-289. doi: 10.1038/s41585-023-00828-w. Epub 2023 Nov 14. Nat Rev Urol. 2024. PMID: 37964070 Review.
-
Role of Alternative Splicing in Prostate Cancer Aggressiveness and Drug Resistance in African Americans.Adv Exp Med Biol. 2019;1164:119-139. doi: 10.1007/978-3-030-22254-3_10. Adv Exp Med Biol. 2019. PMID: 31576545 Free PMC article. Review.
-
Aberrant RNA Splicing in Cancer and Drug Resistance.Cancers (Basel). 2018 Nov 20;10(11):458. doi: 10.3390/cancers10110458. Cancers (Basel). 2018. PMID: 30463359 Free PMC article. Review.
References
-
- Jemal A, Siegel R, Ward E, Hao Y, Xu J, Thun MJ. Cancer statistics, 2009. CA: Cancer Journal for Clinicians. 2009;59(4):225–249. - PubMed
-
- Jemal A, Siegel R, Ward E, et al. Cancer statistics, 2008. CA: Cancer Journal for Clinicians. 2008;58(2):71–96. - PubMed
-
- Gelmann EP. Molecular biology of the androgen receptor. Journal of Clinical Oncology. 2002;20(13):3001–3015. - PubMed
Grants and funding
LinkOut - more resources
Full Text Sources
Other Literature Sources
Research Materials
Miscellaneous

