Chronic endocannabinoid system stimulation induces muscle macrophage and lipid accumulation in type 2 diabetic mice independently of metabolic endotoxaemia
- PMID: 23393605
- PMCID: PMC3564911
- DOI: 10.1371/journal.pone.0055963
Chronic endocannabinoid system stimulation induces muscle macrophage and lipid accumulation in type 2 diabetic mice independently of metabolic endotoxaemia
Abstract
Aims: Obesity and type 2 diabetes are characterised by low-grade inflammation, metabolic endotoxaemia (i.e., increased plasma lipopolysaccharides [LPS] levels) and altered endocannabinoid (eCB)-system tone. The aim of this study was to decipher the specific role of eCB-system stimulation or metabolic endotoxaemia in the onset of glucose intolerance, metabolic inflammation and altered lipid metabolism.
Methods: Mice were treated with either a cannabinoid (CB) receptor agonist (HU210) or low-dose LPS using subcutaneous mini-pumps for 6 weeks. After 3 weeks of the treatment under control (CT) diet, one-half of each group of mice were challenged with a high fat (HF) diet for the following 3-week period.
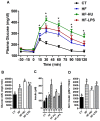
Results: Under basal conditions (control diet), chronic CB receptor agonist treatment (i.e., 6 weeks) induced glucose intolerance, stimulated metabolic endotoxaemia, and increased macrophage infiltration (CD11c and F4/80 expression) in the muscles; this phenomenon was associated with an altered lipid metabolism (increased PGC-1α expression and decreased CPT-1b expression) in this tissue. Chronic LPS treatment tended to increase the body weight and fat mass, with minor effects on the other metabolic parameters. Challenging mice with an HF diet following pre-treatment with the CB agonist exacerbated the HF diet-induced glucose intolerance, the muscle macrophage infiltration and the muscle's lipid content without affecting the body weight or the fat mass.
Conclusion: Chronic CB receptor stimulation under basal conditions induces glucose intolerance, stimulates metabolic inflammation and alters lipid metabolism in the muscles. These effects worsen following the concomitant ingestion of an HF diet. Here, we highlight the central roles played by the eCB system and LPS in the pathophysiology of several hallmarks of obesity and type 2 diabetes.
Conflict of interest statement
Figures


Similar articles
-
The endocannabinoid system links gut microbiota to adipogenesis.Mol Syst Biol. 2010 Jul;6:392. doi: 10.1038/msb.2010.46. Mol Syst Biol. 2010. PMID: 20664638 Free PMC article.
-
Cannabinoid 2 Receptor Agonist Improves Systemic Sensitivity to Insulin in High-Fat Diet/Streptozotocin-Induced Diabetic Mice.Cell Physiol Biochem. 2016;40(5):1175-1185. doi: 10.1159/000453171. Epub 2016 Dec 14. Cell Physiol Biochem. 2016. PMID: 27960161
-
Altered endocannabinoid signalling after a high-fat diet in Apoe(-/-) mice: relevance to adipose tissue inflammation, hepatic steatosis and insulin resistance.Diabetologia. 2011 Nov;54(11):2900-10. doi: 10.1007/s00125-011-2274-6. Epub 2011 Aug 17. Diabetologia. 2011. PMID: 21847582
-
Gut microbiota controls adipose tissue expansion, gut barrier and glucose metabolism: novel insights into molecular _targets and interventions using prebiotics.Benef Microbes. 2014 Mar;5(1):3-17. doi: 10.3920/BM2012.0065. Benef Microbes. 2014. PMID: 23886976 Review.
-
Metabolic endotoxaemia: is it more than just a gut feeling?Curr Opin Lipidol. 2013 Feb;24(1):78-85. doi: 10.1097/MOL.0b013e32835b4431. Curr Opin Lipidol. 2013. PMID: 23298961 Review.
Cited by
-
Endocannabinoids in immune regulation and immunopathologies.Immunology. 2021 Oct;164(2):242-252. doi: 10.1111/imm.13378. Epub 2021 Jul 8. Immunology. 2021. PMID: 34053085 Free PMC article. Review.
-
Endocannabinoid regulation of β-cell functions: implications for glycaemic control and diabetes.Diabetes Obes Metab. 2016 Jun;18(6):549-57. doi: 10.1111/dom.12646. Epub 2016 Mar 31. Diabetes Obes Metab. 2016. PMID: 26880114 Free PMC article. Review.
-
Gut microbiota in overweight and obesity: crosstalk with adipose tissue.Nat Rev Gastroenterol Hepatol. 2024 Mar;21(3):164-183. doi: 10.1038/s41575-023-00867-z. Epub 2023 Dec 8. Nat Rev Gastroenterol Hepatol. 2024. PMID: 38066102 Review.
-
Contribution of the microbiome for better phenotyping of people living with obesity.Rev Endocr Metab Disord. 2023 Oct;24(5):839-870. doi: 10.1007/s11154-023-09798-1. Epub 2023 Apr 29. Rev Endocr Metab Disord. 2023. PMID: 37119391 Free PMC article. Review.
-
Circulating Endocannabinoids and the Polymorphism 385C>A in Fatty Acid Amide Hydrolase (FAAH) Gene May Identify the Obesity Phenotype Related to Cardiometabolic Risk: A Study Conducted in a Brazilian Population of Complex Interethnic Admixture.PLoS One. 2015 Nov 11;10(11):e0142728. doi: 10.1371/journal.pone.0142728. eCollection 2015. PLoS One. 2015. PMID: 26561012 Free PMC article.
References
-
- Olefsky JM, Glass CK (2010) Macrophages, inflammation, and insulin resistance. AnnuRevPhysiol 72: 219–246. - PubMed
-
- Cani PD, Amar J, Iglesias MA, Poggi M, Knauf C, et al. (2007) Metabolic endotoxemia initiates obesity and insulin resistance. Diabetes 56: 1761–1772. - PubMed
-
- Lambert DM, Muccioli GG (2007) Endocannabinoids and related N-acylethanolamines in the control of appetite and energy metabolism: emergence of new molecular players. CurrOpinClinNutrMetab Care 10: 735–744. - PubMed
Publication types
MeSH terms
Substances
Grants and funding
LinkOut - more resources
Full Text Sources
Other Literature Sources
Research Materials
Miscellaneous

