Temporal effects of ethanol consumption on energy homeostasis, hepatic steatosis, and insulin sensitivity in mice
- PMID: 23398239
- PMCID: PMC3657580
- DOI: 10.1111/acer.12075
Temporal effects of ethanol consumption on energy homeostasis, hepatic steatosis, and insulin sensitivity in mice
Abstract
Background: Alcoholic liver disease (ALD) progresses from steatosis to inflammation, fibrosis, and cirrhosis. Although ALD has been associated with insulin resistance, it is unclear whether insulin resistance coincides with the development of steatosis.
Methods: We studied the temporal relationship of steatosis and glucose homeostasis in mice fed a Lieber-DeCarli liquid control or ethanol (EtOH) diet for 2, 4, or 8 weeks. We studied the effects of alcohol consumption on energy balance, body composition, and hepatic lipids. Glucose tolerance test was performed, and insulin sensitivity was evaluated with hyperinsulinemic-euglycemic clamp.
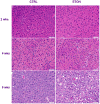
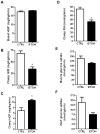
Results: EtOH-fed mice developed hepatic steatosis over time as compared with control-fed mice despite similar energy intake and expenditure, and gain in body weight and fat. EtOH-fed mice developed glucose intolerance as early as 2 weeks, while insulin resistance developed at 4 weeks. A hyperinsulinemic clamp study at 8 weeks revealed both hepatic and peripheral insulin resistance in EtOH-fed mice. Insulin resistance was associated with hepatic steatosis, increased ceramide levels, and Perilipin 2 expression.
Conclusions: Chronic EtOH consumption leads to the development of hepatic steatosis, impaired glucose tolerance, and insulin resistance. These changes are independent of energy intake or expenditure, weight, whole body fat content, and inflammation. A better understanding of the processes linking EtOH-induced steatosis and abnormal glucose homeostasis may lead to novel therapies _targeting the progression of ALD.
Keywords: Alcoholic Steatosis; Ceramides; Insulin Resistance; Metabolic Pheno-typing; Perilipin 2.
Copyright © 2013 by the Research Society on Alcoholism.
Conflict of interest statement
There are no conflicts of interest for any of the authors.
Figures


Similar articles
-
Ceramide synthase 6 (CerS6) is upregulated in alcohol-associated liver disease and exhibits sex-based differences in the regulation of energy homeostasis and lipid droplet accumulation.Mol Metab. 2023 Dec;78:101804. doi: 10.1016/j.molmet.2023.101804. Epub 2023 Sep 14. Mol Metab. 2023. PMID: 37714377 Free PMC article.
-
Absence of perilipin 2 prevents hepatic steatosis, glucose intolerance and ceramide accumulation in alcohol-fed mice.PLoS One. 2014 May 15;9(5):e97118. doi: 10.1371/journal.pone.0097118. eCollection 2014. PLoS One. 2014. PMID: 24831094 Free PMC article.
-
Impact of PPAR-α induction on glucose homoeostasis in alcohol-fed mice.Clin Sci (Lond). 2013 Dec;125(11):501-11. doi: 10.1042/CS20130064. Clin Sci (Lond). 2013. PMID: 23758436
-
Considerations for Maximizing the Exercise "Drug" to Combat Insulin Resistance: Role of Nutrition, Sleep, and Alcohol.Nutrients. 2021 May 18;13(5):1708. doi: 10.3390/nu13051708. Nutrients. 2021. PMID: 34069950 Free PMC article. Review.
-
Relations between metabolic homeostasis, diet, and peripheral afferent neuron biology.Adv Nutr. 2014 Jul 14;5(4):386-93. doi: 10.3945/an.113.005439. Print 2014 Jul. Adv Nutr. 2014. PMID: 25022988 Free PMC article. Review.
Cited by
-
NF-kB Regulation and the Chaperone System Mediate Restorative Effects of the Probiotic Lactobacillus fermentum LF31 in the Small Intestine and Cerebellum of Mice with Ethanol-Induced Damage.Biology (Basel). 2023 Nov 1;12(11):1394. doi: 10.3390/biology12111394. Biology (Basel). 2023. PMID: 37997993 Free PMC article.
-
Decreasing Phosphatidylcholine on the Surface of the Lipid Droplet Correlates with Altered Protein Binding and Steatosis.Cells. 2018 Nov 24;7(12):230. doi: 10.3390/cells7120230. Cells. 2018. PMID: 30477200 Free PMC article.
-
Genetic deletion of the circadian clock transcription factor BMAL1 and chronic alcohol consumption differentially alter hepatic glycogen in mice.Am J Physiol Gastrointest Liver Physiol. 2018 Mar 1;314(3):G431-G447. doi: 10.1152/ajpgi.00281.2017. Epub 2017 Nov 30. Am J Physiol Gastrointest Liver Physiol. 2018. PMID: 29191941 Free PMC article.
-
Roles of Perilipins in Diseases and Cancers.Curr Genomics. 2018 May;19(4):247-257. doi: 10.2174/1389202918666170915155948. Curr Genomics. 2018. PMID: 29755288 Free PMC article.
-
Nonphosphorylatable Src Ser75 Mutation Increases Ethanol Preference and Consumption in Mice.eNeuro. 2019 Apr 5;6(2):ENEURO.0418-18.2019. doi: 10.1523/ENEURO.0418-18.2019. eCollection 2019 Mar-Apr. eNeuro. 2019. PMID: 30963106 Free PMC article.
References
Publication types
MeSH terms
Substances
Grants and funding
- P20RR017677/RR/NCRR NIH HHS/United States
- K08 AA021424/AA/NIAAA NIH HHS/United States
- P30 DK050306/DK/NIDDK NIH HHS/United States
- P30 CA138313/CA/NCI NIH HHS/United States
- P30-DK-50306/DK/NIDDK NIH HHS/United States
- C06 RR018823/RR/NCRR NIH HHS/United States
- P01-DK-049210/DK/NIDDK NIH HHS/United States
- T32-DK-007066/DK/NIDDK NIH HHS/United States
- P30-DK-19525/DK/NIDDK NIH HHS/United States
- P01 DK049210/DK/NIDDK NIH HHS/United States
- T32 DK007066/DK/NIDDK NIH HHS/United States
- P30 DK019525/DK/NIDDK NIH HHS/United States
- P20 RR017677/RR/NCRR NIH HHS/United States
LinkOut - more resources
Full Text Sources
Other Literature Sources
Medical
Research Materials

