_targeting pyruvate carboxylase reduces gluconeogenesis and adiposity and improves insulin resistance
- PMID: 23423574
- PMCID: PMC3712050
- DOI: 10.2337/db12-1311
_targeting pyruvate carboxylase reduces gluconeogenesis and adiposity and improves insulin resistance
Abstract
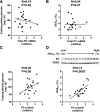
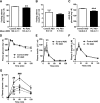
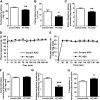
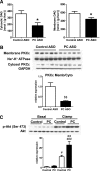
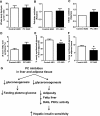
We measured the mRNA and protein expression of the key gluconeogenic enzymes in human liver biopsy specimens and found that only hepatic pyruvate carboxylase protein levels related strongly with glycemia. We assessed the role of pyruvate carboxylase in regulating glucose and lipid metabolism in rats through a loss-of-function approach using a specific antisense oligonucleotide (ASO) to decrease expression predominantly in liver and adipose tissue. Pyruvate carboxylase ASO reduced plasma glucose concentrations and the rate of endogenous glucose production in vivo. Interestingly, pyruvate carboxylase ASO also reduced adiposity, plasma lipid concentrations, and hepatic steatosis in high fat-fed rats and improved hepatic insulin sensitivity. Pyruvate carboxylase ASO had similar effects in Zucker Diabetic Fatty rats. Pyruvate carboxylase ASO did not alter de novo fatty acid synthesis, lipolysis, or hepatocyte fatty acid oxidation. In contrast, the lipid phenotype was attributed to a decrease in hepatic and adipose glycerol synthesis, which is important for fatty acid esterification when dietary fat is in excess. Tissue-specific inhibition of pyruvate carboxylase is a potential therapeutic approach for nonalcoholic fatty liver disease, hepatic insulin resistance, and type 2 diabetes.
Figures


Similar articles
-
PEPCK1 Antisense Oligonucleotide Prevents Adiposity and Impairs Hepatic Glycogen Synthesis in High-Fat Male Fed Rats.Endocrinology. 2019 Jan 1;160(1):205-219. doi: 10.1210/en.2018-00630. Endocrinology. 2019. PMID: 30445425 Free PMC article.
-
3,5 Diiodo-L-Thyronine (T2) Does Not Prevent Hepatic Steatosis or Insulin Resistance in Fat-Fed Sprague Dawley Rats.PLoS One. 2015 Oct 20;10(10):e0140837. doi: 10.1371/journal.pone.0140837. eCollection 2015. PLoS One. 2015. PMID: 26485433 Free PMC article.
-
Dietary conjugated linoleic acid preserves pancreatic function and reduces inflammatory markers in obese, insulin-resistant rats.Metabolism. 2007 Jan;56(1):142-51. doi: 10.1016/j.metabol.2006.09.009. Metabolism. 2007. PMID: 17161237 Clinical Trial.
-
Gluconeogenesis in dairy cows: the secret of making sweet milk from sour dough.IUBMB Life. 2010 Dec;62(12):869-77. doi: 10.1002/iub.400. IUBMB Life. 2010. PMID: 21171012 Review.
-
The pathogenesis of insulin resistance: integrating signaling pathways and substrate flux.J Clin Invest. 2016 Jan;126(1):12-22. doi: 10.1172/JCI77812. Epub 2016 Jan 4. J Clin Invest. 2016. PMID: 26727229 Free PMC article. Review.
Cited by
-
A Look into Liver Mitochondrial Dysfunction as a Hallmark in Progression of Brain Energy Crisis and Development of Neurologic Symptoms in Hepatic Encephalopathy.J Clin Med. 2020 Jul 16;9(7):2259. doi: 10.3390/jcm9072259. J Clin Med. 2020. PMID: 32708652 Free PMC article.
-
Active pyruvate dehydrogenase and impaired gluconeogenesis in orthotopic hepatomas of rats.Metabolism. 2019 Dec;101:153993. doi: 10.1016/j.metabol.2019.153993. Epub 2019 Oct 28. Metabolism. 2019. PMID: 31672442 Free PMC article.
-
A novel in vitro approach to test the effectiveness of fish oil in ameliorating type 1 diabetes.Mol Cell Biochem. 2022 Aug;477(8):2121-2132. doi: 10.1007/s11010-022-04424-1. Epub 2022 May 11. Mol Cell Biochem. 2022. PMID: 35545742
-
Nonalcoholic fatty liver disease, hepatic insulin resistance, and type 2 diabetes.Hepatology. 2014 Feb;59(2):713-23. doi: 10.1002/hep.26672. Hepatology. 2014. PMID: 23929732 Free PMC article. Review.
-
The longevity transporter mIndy (Slc13a5) as a _target for treating hepatic steatosis and insulin resistance.Aging (Albany NY). 2016 Feb;8(2):208-9. doi: 10.18632/aging.100907. Aging (Albany NY). 2016. PMID: 26928109 Free PMC article. No abstract available.
References
-
- Maggs DG, Buchanan TA, Burant CF, et al. Metabolic effects of troglitazone monotherapy in type 2 diabetes mellitus. A randomized, double-blind, placebo-controlled trial. Ann Intern Med 1998;128:176–185 - PubMed
-
- Utter MF, Keech DB. Formation of oxaloacetate from pyruvate and carbon dioxide. J Biol Chem 1960;235:PC17–PC18 - PubMed
-
- Weber G, Cantero A. Glucose-6-phosphatase studies in fasting. Science 1954;120:851–852 - PubMed
Publication types
MeSH terms
Substances
Grants and funding
- P30-DK-45735/DK/NIDDK NIH HHS/United States
- R24-DK-085638/DK/NIDDK NIH HHS/United States
- UL1-RR-0241395/RR/NCRR NIH HHS/United States
- I01 BX000901/BX/BLRD VA/United States
- R01 DK088231/DK/NIDDK NIH HHS/United States
- R01 DK040936/DK/NIDDK NIH HHS/United States
- R24 DK085638/DK/NIDDK NIH HHS/United States
- R01 AG023686/AG/NIA NIH HHS/United States
- P30 DK045735/DK/NIDDK NIH HHS/United States
- P30-DK-034989/DK/NIDDK NIH HHS/United States
- R01-DK-40936/DK/NIDDK NIH HHS/United States
- R01-AG-23686/AG/NIA NIH HHS/United States
- U24 DK059635/DK/NIDDK NIH HHS/United States
- R01-DK-34989/DK/NIDDK NIH HHS/United States
- R01-DK-088231/DK/NIDDK NIH HHS/United States
- P30 DK034989/DK/NIDDK NIH HHS/United States
LinkOut - more resources
Full Text Sources
Other Literature Sources
Molecular Biology Databases

