. 2013 Apr 1;12(7):1022-9.
doi: 10.4161/cc.24128. Epub 2013 Mar 6.

Dissecting the pathways that destabilize mutant p53: the proteasome or autophagy?

Affiliations

Dissecting the pathways that destabilize mutant p53: the proteasome or autophagy?

Sujata Choudhury et al. Cell Cycle. .

Abstract

One fundamental feature of mutant forms of p53 consists in their accumulation at high levels in tumors. At least in the case of neomorphic p53 mutations, which acquire oncogenic activity, stabilization is a driving force for tumor progression. It is well documented that p53 mutants are resistant to proteasome-dependent degradation compared with wild-type p53, but the exact identity of the pathways that affect mutant p53 stability is still debated. We have recently shown that macroautophagy (autophagy) provides a route for p53 mutant degradation during restriction of glucose. Here we further show that in basal conditions of growth, inhibition of autophagy with chemical inhibitors or by downregulation of the essential autophagic genes ATG1/Ulk1, Beclin-1 or ATG5, results in p53 mutant stabilization. Conversely, overexpression of Beclin-1 or ATG1/Ulk1 leads to p53 mutant depletion. Furthermore, we found that in many cell lines, prolonged inhibition of the proteasome does not stabilize mutant p53 but leads to its autophagic-mediated degradation. Therefore, we conclude that autophagy is a key mechanism for regulating the stability of several p53 mutants. We discuss plausible mechanisms involved in this newly identified degradation pathway as well as the possible role played by autophagy during tumor evolution driven by mutant p53.

Keywords: autophagy; cancer; mutant; mutations; p53; proteasome; ubiquitin tumor.


Figures
None
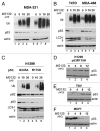
Figure 1. Prolonged proteasome inhibition leads to p53 mutant depletion. (A) MDA-231 cells were treated with vehicle control, (DMSO) (lanes 1 and 5) or with 5 μM (lanes 2 and 6); 10 μM (lane 3 and 7) or 20 μM (lane 4 and 8) of MG132 for 3 h (lanes 1–4) or 18 h (lane 5–9). The expression levels of p53 or ubiquitinated proteins and actin are shown. (B) T47D (lanes 1–4) or MDA-468 (lanes 5 and 6) were mock treated (lanes 1 and 5) or treated with increasing concentrations of MG132 for 16 h. The expression levels of LC3, p53 and ubiquitinated proteins are shown. (C) Proteasome block induces p53 depletion in cells ectopically expressing p53. For these experiments, we employed H1299 cells ectopically expressing mutant p53G245 or p53H175R under the control of a tetracycline-regulated promoter. Cells were subjected to a short doxycycline treatment for 6 h, then they were washed and received fresh media lacking (lanes 1 and 4) or containing 10 μM (lanes 2 and 5) or 20 μM (lanes 3 and 6) MG132 for additional 12 h. The levels of ubiquitinated proteins, p62, p53 and LC3 are shown. (D–F) H1299 cells expressing p53R175H (D), lanes 1–4), TOV cells (E) or MCF7 cells (F) were treated with 20 μM MG132 for 8 to 12 h (indicated as time 0; lane 1 in all panels). After this time, cells were washed twice with PBS and were re-incubated in regular media for 4 h (lane 2), for 8 h (lane 3) or for 12 h (lane 4). The anti-p53 and anti-actin immunoblots are shown.
None
Figure 2. Inhibition of autophagy increases mutant p53 half-life. (A) MDA-231 cells were transfected with control shRNA (lanes 1–3) or with shRNA for ATG1/Ulk1 (indicated as Ulk1, lanes 4–6) or ATG5 (lanes 7–9). Cells were left untreated (lanes 1, 4 and 7) or were treated with 10 μM (lanes 2, 5 and 8) or 20 μM (lanes 3, 6 and 9) MG132 for 12 h. The panels show the immunoblots for Ulk1, ATG5, LC3 and p53 (with two different exposures of the anti-p53 blot outlined by the vertical line). (B) Assessment of p53 expression half-life in the absence (lanes 1–3) or presence of MG132 (20 μM, lanes 4–6) or chloroquine (50 μM, lanes 7–9). A group of cells received CHX for 12 h (lanes 2, 5 and 8) or 24 h (lanes 3, 6 and 9). The levels of ubiquitinated proteins, of p53, p62, LC3 and actin were assessed. Note the pattern of LC3 conversion and the difference in p62 levels in the MG132 and CHQ treated samples, relative to control.
None
Figure 3. Autophagy controls mutant p53 expression levels. (A) p53 expression and half-life were studied in stable MDA-231 cells harboring control shRNAs (lanes 1 and 2) or the shRNAs for Ulk1 (lanes 3 and 4) in the absence (lanes 1 and 3) or presence (lanes 2 and 4) of 50 μM CHX for 24 h. Note the presence of high molecular weight forms of p53 displaying a migration pattern consistent with ubiquitination in Ulk1-shRNA cells. In (B), the relative expression levels of Ulk1 in cells harboring the Ulk1 or control shRNA are shown. (C) p53, Beclin and actin expression levels in TOV cells transfected with control or Beclin-specific siRNA. Images shown are derived from the same autoradiogram, where lanes between relevant samples were cut. (D) The panel shows p53 expression in control shRNA harboring cells or in two different clones expressing the ATG5 shRNA (indicated as ATG5-1 and 2). (E) MDA-231 cells were transfected with control DNA (pcDNA/TO, 8 μg/plate) or with identical concentration of the cDNA expressing Beclin-1. p53, Beclin-1 and actin levels were assessed 48–72 h after transfection. (F) H1299 cells infected with control adenovirus (lanes 1 and 2) or with p53RH175H-expressing adenovirus (lanes 3 and 4) were transfected with a control vector (lanes 1 and 3) or with the Ulk1 expressing vector (lanes 3 and 4). The expression levels of Ulk1, p53 and tubulin are shown. Note that endogenous Ulk1 is not detectable in H1299 cells at exposure times in which the ectopically expressed is clearly visible.
None
Figure 4. Summary of the available literature depicting relevant examples of oncogenic proteins degraded via autophagy and the molecular changes involved (see text for explanation). Autophagic degradation of members of the Dishevelled (Dvl) family is triggered by starvation and involves Dvl ubiquitination, in turn mediated by VHL, as well as aggregation and the interaction with p62. Glucose restriction induces mutant p53 deacetylation, increases the interaction with MDM2 as well as ubiquitination and mutant p53 detection in p62-positive aggregates. In the case of NIK and of IkB-kinase, IKK, autophagic degradation is induced by treatment with the Hsp90 inhibitor, geldanamycin, which, in turn, leads to release of these proteins from the interaction with Hsp90., In this case, ubiquitination is apparently dispensable for autophagy-dependent degradation. In two other studies, treatment with arsenic trioxide induced aggregation and the interaction of BCR-ABL or PML-RARA with p62 followed by autophagic degradation., Whether degradation requires ubiquitination was not directly addressed in these studies.
None
Figure 5. Hypothetical role played by the ubiquitin code in proteasomal or autophagic degradation (see also text for explanation). While substrates modified by K48-linked ubiquitin chains are recognized by the proteasome, K63 chain formation is involved in a variety of other functions, including in the autophagic clearance of micro- or macro-aggregates. CHIP can catalyze K63 ubiquitination when in combination with Ubc13. In the case of MDM2 K63 chain formation required MDMX. We speculate that K63-linked ubiquitin chains may play a role in autophagic disruption of mutant p53. Other studies have shown that mutant p53 localize in aggresomes, wherein misfolded proteins are either stored or cleared by autophagy. The observation that p300 inhibits autophagy and is necessary for aggresome formation raises the possibility that autophagic degradation of mutant p53 within aggresomes is regulated by the interaction with p300.
None
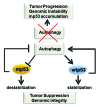
Figure 6. Significance of the cross-talk between wild-type and mutant p53 with autophagy. The figure depicts a summary of some of the available data highlighting a possible antagonistic feedback loop between mutant p53 and autophagy in contrast to cooperative effects described between wild-type p53 and autophagy, and their consequences on tumorigenesis (see also text for explanations).

Similar articles

Cited by

References

    1. Freed-Pastor WA, Prives C. Mutant p53: one name, many proteins. Genes Dev. 2012;26:1268–86. doi: 10.1101/gad.190678.112. - DOI - PMC - PubMed
    1. Donehower LA, Lozano G. 20 years studying p53 functions in genetically engineered mice. Nat Rev Cancer. 2009;9:831–41. doi: 10.1038/nrc2731. - DOI - PubMed
    1. Brosh R, Rotter V. When mutants gain new powers: news from the mutant p53 field. Nat Rev Cancer. 2009;9:701–13. - PubMed
    1. Terzian T, Suh YA, Iwakuma T, Post SM, Neumann M, Lang GA, et al. The inherent instability of mutant p53 is alleviated by Mdm2 or p16INK4a loss. Genes Dev. 2008;22:1337–44. doi: 10.1101/gad.1662908. - DOI - PMC - PubMed
    1. Puca R, Nardinocchi L, Porru M, Simon AJ, Rechavi G, Leonetti C, et al. Restoring p53 active conformation by zinc increases the response of mutant p53 tumor cells to anticancer drugs. Cell Cycle. 2011;10:1679–89. doi: 10.4161/cc.10.10.15642. - DOI - PubMed

Publication types

MeSH terms

  NODES
Note 3
twitter 2