. 2013;8(3):e58749.
doi: 10.1371/journal.pone.0058749. Epub 2013 Mar 13.

PTB-associated splicing factor (PSF) is a PPARγ-binding protein and growth regulator of colon cancer cells

Affiliations

PTB-associated splicing factor (PSF) is a PPARγ-binding protein and growth regulator of colon cancer cells

Tamotsu Tsukahara et al. PLoS One. 2013.

Abstract

Peroxisome proliferator-activated receptor gamma (PPARγ) is a nuclear receptor that plays an essential role in cell proliferation, apoptosis, and inflammation. It is over-expressed in many types of cancer, including colon, stomach, breast, and lung cancer, suggesting that regulation of PPARγ might affect cancer pathogenesis. Here, using a proteomic approach, we identify PTB-associated splicing factor (PSF) as a novel PPARγ-interacting protein and demonstrate that PSF is involved in several important regulatory steps of colon cancer cell proliferation. To investigate the relationship between PSF and PPARγ in colon cancer, we evaluated the effects of PSF expression in DLD-1 and HT-29 colon cancer cell lines, which express low and high levels of PPARγ, respectively PSF affected the ability of PPARγ to bind, and expression of PSF siRNA significantly suppressed the proliferation of colon cancer cells. Furthermore, PSF knockdown induced apoptosis via activation of caspase-3. Interestingly, DLD-1 cells were more susceptible to PSF knockdown-induced cell death than HT-29 cells. Our data suggest that PSF is an important regulator of cell death that plays critical roles in the survival and growth of colon cancer cells. The PSF-PPARγ axis may play a role in the control of colorectal carcinogenesis. Taken together, this study is the first to describe the effects of PSF on cell proliferation, tumor growth, and cell signaling associated with PPARγ.


Conflict of interest statement

Competing Interests: The authors have declared that no competing interests exist.

Figures

Figure 1
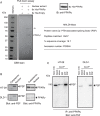
Figure 1. Physical interaction between PPARγ and PSF in HT-29 cells.
(A) Pull-down affinity-binding assay with purified PPARγ. Full-length PPARγ expressed in E. coli as a 6×His-tagged fusion protein was isolated and purified using TALON resin (upper right panel). The 6×His-tagged PPARγ protein was incubated with nuclear extracts isolated from HT-29 cells. After washing with wash buffer, the resin was collected by centrifugation, and SDS-PAGE was performed with a 5–20% (w/v) acrylamide gel. The separated protein bands were visualized by Coomassie Brilliant Blue. The protein band (a) was excised from the gel, digested with trypsin, and identified by mass fingerprinting. The number of peptides, percentage of sequence coverage, and the accession number for the protein are given in Table S1. (B) Verification of the localization of PSF in nuclear and cytosolic extracts from HT-29 and DLD-1 cells. Cytosolic extracts and nuclear extracts were prepared from cells and analyzed by immunoblotting using an antibody against human PSF. Immunofluorescence staining of formalin-fixed HT-29 and DLD-1 cells shows the nuclear localization of PSF (right panel). (C) HT-29 cells were lysed with lysis buffer and then analyzed by co-immunoprecipitation and western blotting with anti-PSF antibody. Beads alone and normal rabbit serum (IgG) were used as negative controls. Arrows show the position of PSF (100 kDa).
Figure 2
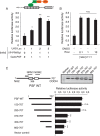
Figure 2. The first central region of the nucleotide-binding domain is required for the interaction with PPARγ.
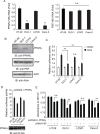
(A) Schematic diagram of the two-hybrid assay using full-length PSF and PPARγ. For the mammalian two-hybrid assay, CV-1 cells were co-transfected with GAL4-UAS-Luc alone or in combination with pFN11A-PSF (BIND) and pFN10A-PPARγ1 (VP16 transactivator). After 24 h of incubation, the cells were lysed, and luciferase activity was measured. The results are shown as fold induction compared to the negative control (GAL4-UAS-Luc alone) and represent the mean of triplicates from a representative experiment, with error bars showing the standard deviation. (B) CV-1 cells were co-transfected with GAL4-UAS-Luc, pFN11A-PSF, and pFN10A-PPARγ1. After 24 h of incubation, the cells were treated with rosiglitazone, and luciferase activity was measured. Rosiglitazone treatment (0.1–10 µM) did not affect the PSF-PPARγ interaction. (C) Schematic representation of PSF based on the domain prediction tool SMRT; the nucleotide-binding domain is indicated. Domains within PSF include the C-terminus nucleotide recognition motifs (NRM1 and NRM2) and the highly charged domain. The N-terminus contains proline-glutamine-rich domains and arginine-glycine-rich domains. The interaction of PPARγ1 with the truncated forms of PSF was analyzed using the mammalian two-hybrid assay. CV-1 cells were transfected with plasmids for the expression of the GAL4-UAS-Luc, pFN11A-PSF chimeric protein, VP-16-PPARγ1 proteins, and the indicated deletion mutants. The fold induction of luciferase activity was calculated relative to the negative control. The error bars represent the standard deviation.
Figure 3
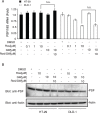
Figure 3. PPARγ activation is not involved in PSF downregulation in HT-29 and DLD-1 cells.
(A) Real-time PCR measurement of PSF mRNA and protein expression in HT-29 and DLD-1 cells. Cells were treated with vehicle (DMSO), rosiglitazone (Rosi), or GW9662 (GW) for 20 h. PCR was performed using specific primers for PSF. The relative PSF levels were normalized to 18S- rRNA and are expressed as mean ± SEM (n = 3), **P<0.01. The addition of GW9662 together with Rosi did not change PSF mRNA and protein expression levels. Protein levels were analyzed by SDS-PAGE and western blot and visualized with enhanced chemiluminescence reagent. Each lane was loaded with 50 µg whole-cell lysate. β-actin was used as a loading control.
Figure 4
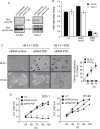
Figure 4. Downregulation of PSF inhibits the proliferation of colorectal cancer cells.
(A) Expression of PSF was knocked down in HT-29 and DLD-1 cells. Total protein was extracted from untransfected (UT), control siRNA-, or PSF siRNA-transfected cells. Forty-eight hours later, whole-cell lysates were subjected to western blot analysis for PSF. Incubation with an anti-β-actin antibody was used as a protein-loading control. (B) The effect of siRNA on mRNA expression in HT-29 and DLD-1 cells. The efficiency of PSF knockdown was calculated to be 80% by real-time quantitative RT-PCR. Data are presented as means ± SEM (n = 3). (C) At 24 h post transfection, cells were re-plated in 96-well plates (5×10³ cells/well) and incubated for 48 h. Cytoplasmic vacuolization was evident in DLD-1 cells in phase contrast images after siRNA transfection (indicated by arrows). Vacuolated cells were analyzed and counted as described in the Materials and Methods section. At least 3 fields of cells per sample were counted and tabulated. Data are expressed as mean ± SEM (n = 3), **P<0.01. (D) Time-dependent cell growth inhibition was measured using the Cell Counting Kit-8 at 24, 48, 72, 96, and 120 h after siRNA transfection. An equal number of cells (1×10⁵ cells/well) were seeded in 6-well plates and then incubated for 24 h at 37°C in an incubator with 5% CO2. Then, 10 µL of Cell Counting Kit-8 was added to the medium and incubated for 2 h in the incubator (5% CO2). The amount of orange formazan dye generated was calculated by measuring the absorbance at 450 nm in a microplate reader. Data are expressed as means ± SEM (n = 4), **P<0.01.
Figure 5
Figure 5. Real-time PCR measurement of PPARγ mRNA expression in 4 colon cancer cell lines.
(A) The relative PPARγ levels (HT-29, DLD-1, Caco-2, and LOVO). normalized to 18S rRNA are expressed as mean ± SEM (n = 3), **P<0.01. (B) Representative western blot of PPARγ1 expression. Cell lines were separated into nuclear and cytoplasmic fractions, and 50 µg of protein from the cytoplasmic fraction was analyzed by SDS-PAGE, western blotted, and visualized with enhanced chemiluminescence as described in the Materials and Methods section. (C) and (D) Effect of rosiglitazone on reporter activation in colon cancer cells. Cells were transiently transfected with a pGL3-PPRE-acyl-CoA oxidase luciferase reporter vector or pcDNA3.1-PPARγ vector. The cells were treated with 10 µM rosiglitazone for 20 h. Luciferase activity was normalized to Renilla luciferase activity. Data are expressed as mean ± SEM (n = 4), **P<0.01. (E) Cells were transfected with expression plasmids encoding FLAG-PPARγ and siRNA PSF for 72 h. Next, 10 µL of Cell Counting Kit-8 was added to the medium and incubated for 2 h in an incubator with 5% CO2. The amount of orange formazan dye generated was calculated by measuring the absorbance at 450 nm in a microplate reader. Data are expressed as mean ± SEM (n = 4), **P<0.01.
Figure 6
Figure 6. PSF knockdown induces DNA condensation in DLD-1 but not HT-29 cells.
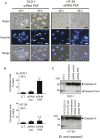
(A) Cells were seeded at a density of 5×10³ cells/well in 96-well plates in DMEM with 10% FBS. After 96 h, cells were stained with Hoechst 33342 and analyzed by fluorescence microscopy. Apoptotic nuclei were brightly stained compared to nuclei in untransfected cells or siRNA control-transfected cells. (B) At least 5 fields of cells per sample were counted and tabulated; values are expressed as mean ± SEM (n = 5), **P<0.05 based on Student’s t-test. (C) Both cell lines were seeded at a density of 1×10⁵ cells/well in 6-well plates in DMEM with 10% FBS. After 96 h, cell lysates were collected in RIPA buffer, and 50 µg of protein was loaded for SDS-PAGE. The apoptosis assay was carried out using an anti-caspase-3 antibody. 5-Fluorouracil (5-FU, 10 µM) was used as a positive control.
Figure 7
Figure 7. VDAC2 levels are up-regulated under PSF knockdown conditions in DLD-1 cells.
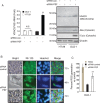
(A) After PSF siRNA transfection, the expression of VDAC2 was further confirmed at the transcriptional level by real-time PCR and at the protein level by western blot. (B) Fluorescence microscopy of living cells stained with rhodamine 123. DLD-1 cells were stained with 100 nM rhodamine 123 for 30 min, rinsed in PBS, and imaged on an Olympus fluorescence microscope using a Cy3 filter. Nuclei were stained with Hoechst 33342. (C) ROS generation in DLD-1 cells after PSF knockdown. Intracellular production of ROS in DLD-1 cells treated with PSF siRNA. Hydrogen peroxide (100 µM) was used as positive control. Data are expressed as mean ± SEM (n = 3), **P<0.01.
Figure 8
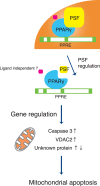
Figure 8. Scheme for the role of PSF in PPARγ-mediated gene regulation.

Similar articles

Cited by

References

    1. Siegel R, Naishadham D, Jemal A (2012) Cancer statistics, 2012. CA Cancer J Clin 62: 10–29. - PubMed
    1. Goldberg RM (2006) Therapy for metastatic colorectal cancer. Oncologist 11: 981–987. - PubMed
    1. Haddad AJ, Bani Hani M, Pawlik TM, Cunningham SC (2011) Colorectal liver metastases. Int J Surg Oncol 2011: 285840. - PMC - PubMed
    1. Issemann I, Green S (1990) Activation of a member of the steroid hormone receptor superfamily by peroxisome proliferators. Nature 347: 645–650. - PubMed
    1. Evans RM (2005) The nuclear receptor superfamily: a rosetta stone for physiology. Mol Endocrinol 19: 1429–1438. - PubMed

Publication types

Grants and funding

This work was supported by Grants-in-Aid for Scientific Research (C) 22591482 (to Tamotsu Tsukahara) from the Japan Society for the Promotion of Science, and Grants-in-Aid from Takeda Science Foundation (to Tamotsu Tsukahara) and Astellas foundation for research on metabolic disorders (to Tamotsu Tsukahara). The funders had no role in study design, data collection and analysis, decision to publish, or preparation of the manuscript.
  NODES
twitter 2