Kielin/chordin-like protein attenuates both acute and chronic renal injury
- PMID: 23539757
- PMCID: PMC3665392
- DOI: 10.1681/ASN.2012070759
Kielin/chordin-like protein attenuates both acute and chronic renal injury
Abstract
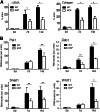
The secreted kielin/chordin-like (KCP) protein, one of a family of cysteine-rich proteins, suppresses TGF-β signaling by sequestering the ligand from its receptor, but it enhances bone morphogenetic protein (BMP) signaling by promoting ligand-receptor interactions. Given the critical roles for TGF-β and BMP proteins in enhancing or suppressing renal interstitial fibrosis, respectively, we examined whether secreted KCP could attenuate renal fibrosis in mouse models of chronic and acute disease. Transgenic mice that express KCP in adult kidneys showed significantly less expression of collagen IV, α-smooth muscle actin, and other markers of disease progression in the unilateral ureteral obstruction model of renal interstitial fibrosis. In the folic acid nephrotoxicity model of acute tubular necrosis, mice expressing KCP survived high doses of folic acid that were lethal for wild-type mice. With a lower dose of folic acid, mice expressing KCP exhibited improved renal recovery compared with wild-type mice. Thus, these data suggest that extracellular regulation of the TGF-β/BMP signaling axis by KCP, and by extension possibly other cysteine-rich domain proteins, can attenuate both acute and chronic renal injury.
Figures


Comment in
-
The Kielin/chordin-like protein checkpoint constitutes a system of checks and balances in CKD.J Am Soc Nephrol. 2013 May;24(6):863-5. doi: 10.1681/ASN.2013040412. Epub 2013 May 16. J Am Soc Nephrol. 2013. PMID: 23687357 No abstract available.
Similar articles
-
The cysteine-rich domain protein KCP is a suppressor of transforming growth factor beta/activin signaling in renal epithelia.Mol Cell Biol. 2006 Jun;26(12):4577-85. doi: 10.1128/MCB.02127-05. Mol Cell Biol. 2006. PMID: 16738323 Free PMC article.
-
The kielin/chordin-like protein (KCP) attenuates high-fat diet-induced obesity and metabolic syndrome in mice.J Biol Chem. 2017 Jun 2;292(22):9051-9062. doi: 10.1074/jbc.M116.771428. Epub 2017 Apr 19. J Biol Chem. 2017. PMID: 28424263 Free PMC article.
-
The kielin/chordin-like protein KCP attenuates nonalcoholic fatty liver disease in mice.Am J Physiol Gastrointest Liver Physiol. 2016 Oct 1;311(4):G587-G598. doi: 10.1152/ajpgi.00165.2016. Epub 2016 Aug 11. Am J Physiol Gastrointest Liver Physiol. 2016. PMID: 27514479 Free PMC article.
-
Central role of dysregulation of TGF-β/Smad in CKD progression and potential _targets of its treatment.Biomed Pharmacother. 2018 May;101:670-681. doi: 10.1016/j.biopha.2018.02.090. Epub 2018 Mar 22. Biomed Pharmacother. 2018. PMID: 29518614 Review.
-
Role of the TGF-β/BMP-7/Smad pathways in renal diseases.Clin Sci (Lond). 2013 Feb;124(4):243-54. doi: 10.1042/CS20120252. Clin Sci (Lond). 2013. PMID: 23126427 Review.
Cited by
-
Bone morphogenetic proteins and their antagonists: current and emerging clinical uses.Br J Pharmacol. 2014 Aug;171(15):3620-32. doi: 10.1111/bph.12724. Br J Pharmacol. 2014. PMID: 24758361 Free PMC article. Review.
-
Non-coding RNA-Associated ceRNA Networks in a New Contrast-Induced Acute Kidney Injury Rat Model.Mol Ther Nucleic Acids. 2019 Sep 6;17:102-112. doi: 10.1016/j.omtn.2019.05.011. Epub 2019 May 28. Mol Ther Nucleic Acids. 2019. PMID: 31234008 Free PMC article.
-
Folate nutrition and blood-brain barrier dysfunction.Curr Opin Biotechnol. 2017 Apr;44:146-152. doi: 10.1016/j.copbio.2017.01.006. Epub 2017 Feb 10. Curr Opin Biotechnol. 2017. PMID: 28189938 Free PMC article. Review.
-
The Role of Bone Morphogenetic Protein 7 (BMP-7) in Inflammation in Heart Diseases.Cells. 2020 Jan 23;9(2):280. doi: 10.3390/cells9020280. Cells. 2020. PMID: 31979268 Free PMC article. Review.
-
AKI on CKD: heightened injury, suppressed repair, and the underlying mechanisms.Kidney Int. 2017 Nov;92(5):1071-1083. doi: 10.1016/j.kint.2017.06.030. Epub 2017 Sep 8. Kidney Int. 2017. PMID: 28890325 Free PMC article. Review.
References
-
- Harris RC, Neilson EG: Toward a unified theory of renal progression. Annu Rev Med 57: 365–380, 2006 - PubMed
-
- Böttinger EP, Bitzer M: TGF-beta signaling in renal disease. J Am Soc Nephrol 13: 2600–2610, 2002 - PubMed
-
- Kopp JB, Factor VM, Mozes M, Nagy P, Sanderson N, Böttinger EP, Klotman PE, Thorgeirsson SS: Transgenic mice with increased plasma levels of TGF-beta 1 develop progressive renal disease. Lab Invest 74: 991–1003, 1996 - PubMed
-
- Ledbetter S, Kurtzberg L, Doyle S, Pratt BM: Renal fibrosis in mice treated with human recombinant transforming growth factor-beta2. Kidney Int 58: 2367–2376, 2000 - PubMed
Publication types
MeSH terms
Substances
Grants and funding
LinkOut - more resources
Full Text Sources
Other Literature Sources
Medical
Molecular Biology Databases

