Selectively bred rat model system for low and high response to exercise training
- PMID: 23715262
- PMCID: PMC3727016
- DOI: 10.1152/physiolgenomics.00021.2013
Selectively bred rat model system for low and high response to exercise training
Abstract
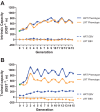
We initiated a large-scale bidirectional selection experiment in a genetically heterogeneous rat population (N/NIH stock, n = 152) to develop lines of low response trainers (LRT) and high response trainers (HRT) as a contrasting animal model system. Maximal treadmill running distance [meters (m)] was tested before (DIST(1)) and after (DIST(2)) standardized aerobic treadmill training over an 8 wk period (3 exercise sessions per week). Response to training was calculated as the change in exercise capacity (ΔDIST = DIST(2) - DIST(1)). A within-family selection and rotational breeding paradigm between 10 families was practiced for both selected lines. For the founder population, exercise training produced a 140 ± 15 m gain in exercise capacity with interindividual variation ranging from -339 to +627 m. After 15 generations of selection (n = 3,114 rats), HRT rats improved 223 ± 20 m as a result of exercise training while exercise capacity declined -65 ± 15 m in LRT rats given the same absolute training environment. The narrow-sense heritability (h(2)) for ΔDIST was 0.10 ± 0.02. The LRT and HRT lines did not differ significantly for body weight or intrinsic (i.e., DIST(1)) exercise capacity. Using pedigree records the inbreeding coefficient increased at a rate of 1.7% per generation for HRT and 1.6% per generation for LRT, ∼30% slower than expected from random mating. Animal models developed from heterogeneous stock and enriched via selection, as presented here, often generate extreme values for traits of interest and may prove more useful than current models for uncovering genetic underpinnings.
Keywords: aerobic capacity; exercise training response; gene-environment interaction; inbred strains.
Figures


Similar articles
-
Selected contribution: Variation and heritability for the adaptational response to exercise in genetically heterogeneous rats.J Appl Physiol (1985). 2003 Apr;94(4):1674-81. doi: 10.1152/japplphysiol.00851.2002. Epub 2002 Nov 1. J Appl Physiol (1985). 2003. PMID: 12433846
-
Late life maintenance and enhancement of functional exercise capacity in low and high responding rats after low intensity treadmill training.Exp Gerontol. 2019 Oct 1;125:110657. doi: 10.1016/j.exger.2019.110657. Epub 2019 Jul 12. Exp Gerontol. 2019. PMID: 31306740 Free PMC article.
-
Myokine Responses to Exercise in a Rat Model of Low/High Adaptive Potential.Front Endocrinol (Lausanne). 2021 Jun 9;12:645881. doi: 10.3389/fendo.2021.645881. eCollection 2021. Front Endocrinol (Lausanne). 2021. PMID: 34177798 Free PMC article.
-
Systemic oxygen transport in rats artificially selected for running endurance.Respir Physiol Neurobiol. 2006 Apr 28;151(2-3):141-50. doi: 10.1016/j.resp.2005.09.012. Epub 2005 Dec 15. Respir Physiol Neurobiol. 2006. PMID: 16344008 Review.
-
A rat model system to study complex disease risks, fitness, aging, and longevity.Trends Cardiovasc Med. 2012 Feb;22(2):29-34. doi: 10.1016/j.tcm.2012.06.007. Epub 2012 Aug 4. Trends Cardiovasc Med. 2012. PMID: 22867966 Free PMC article. Review.
Cited by
-
Role of intrinsic aerobic capacity and ventilator-induced diaphragm dysfunction.J Appl Physiol (1985). 2015 Apr 1;118(7):849-57. doi: 10.1152/japplphysiol.00797.2014. Epub 2015 Jan 8. J Appl Physiol (1985). 2015. PMID: 25571991 Free PMC article.
-
Low Response to Aerobic Training in Metabolic Disease: Role of Skeletal Muscle.Exerc Sport Sci Rev. 2024 Apr 1;52(2):47-53. doi: 10.1249/JES.0000000000000331. Epub 2023 Dec 17. Exerc Sport Sci Rev. 2024. PMID: 38112622
-
Effect of short-term hindlimb immobilization on skeletal muscle atrophy and the transcriptome in a low compared with high responder to endurance training model.PLoS One. 2022 Jan 13;17(1):e0261723. doi: 10.1371/journal.pone.0261723. eCollection 2022. PLoS One. 2022. PMID: 35025912 Free PMC article.
-
The molecular athlete: exercise physiology from mechanisms to medals.Physiol Rev. 2023 Jul 1;103(3):1693-1787. doi: 10.1152/physrev.00017.2022. Epub 2023 Jan 5. Physiol Rev. 2023. PMID: 36603158 Free PMC article. Review.
-
Humanized animal exercise model for clinical implication.Pflugers Arch. 2014 Sep;466(9):1673-87. doi: 10.1007/s00424-014-1496-0. Epub 2014 Mar 21. Pflugers Arch. 2014. PMID: 24647666 Review.
References
-
- Albert FW, Carlborg O, Plyusnina I, Besnier F, Hedwig D, Lautenschlager S, Lorenz D, McIntosh J, Neumann C, Richter H, Zeising C, Kozhemyakina R, Shchepina O, Kratzsch J, Trut L, Teupser D, Thiery J, Schoneberg T, Andersson L, Paabo S. Genetic architecture of tameness in a rat model of animal domestication. Genetics 182: 541–554, 2009 - PMC - PubMed
-
- Blair SN, Kampert JB, Kohl HW, 3rd, Barlow CE, Macera CA, Paffenbarger RS, Jr, Gibbons LW. Influences of cardiorespiratory fitness and other precursors on cardiovascular disease and all-cause mortality in men and women. JAMA 276: 205–210, 1996 - PubMed
-
- Blair SN, Kohl HW, 3rd, Barlow CE, Paffenbarger RS, Jr, Gibbons LW, Macera CA. Changes in physical fitness and all-cause mortality A prospective study of healthy and unhealthy men. JAMA 273: 1093–1098, 1995 - PubMed
-
- Blair SN, Kohl HW, 3rd, Paffenbarger RS, Jr, Clark DG, Cooper KH, Gibbons LW. Physical fitness and all-cause mortality A prospective study of healthy men and women. JAMA 262: 2395–2401, 1989 - PubMed
-
- Bouchard C, An P, Rice T, Skinner JS, Wilmore JH, Gagnon J, Perusse L, Leon AS, Rao DC. Familial aggregation of VO2 max response to exercise training: results from the Heritage family study. J Appl Physiol 87: 1003–1008, 1999 - PubMed
Publication types
MeSH terms
Grants and funding
LinkOut - more resources
Full Text Sources
Other Literature Sources

