Amplification of the MET receptor drives resistance to anti-EGFR therapies in colorectal cancer
- PMID: 23729478
- PMCID: PMC4078408
- DOI: 10.1158/2159-8290.CD-12-0558
Amplification of the MET receptor drives resistance to anti-EGFR therapies in colorectal cancer
Abstract
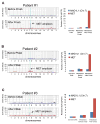
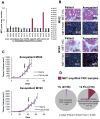
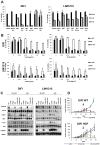
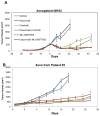
EGF receptor (EGFR)-_targeted monoclonal antibodies are effective in a subset of metastatic colorectal cancers. Inevitably, all patients develop resistance, which occurs through emergence of KRAS mutations in approximately 50% of the cases. We show that amplification of the MET proto-oncogene is associated with acquired resistance in tumors that do not develop KRAS mutations during anti-EGFR therapy. Amplification of the MET locus was present in circulating tumor DNA before relapse was clinically evident. Functional studies show that MET activation confers resistance to anti-EGFR therapy both in vitro and in vivo. Notably, in patient-derived colorectal cancer xenografts, MET amplification correlated with resistance to EGFR blockade, which could be overcome by MET kinase inhibitors. These results highlight the role of MET in mediating primary and secondary resistance to anti-EGFR therapies in colorectal cancer and encourage the use of MET inhibitors in patients displaying resistance as a result of MET amplification.
Conflict of interest statement
T. Perera is a full-time employee of Janssen Pharmaceutica and a shareholder of Johnson and Johnson, the manufacturer of JNJ38877605. L.A.D. and V.E.V. are co-founders of Inostics and Personal Genome Diagnostics and are members of their Scientific Advisory Boards. L.A.D. and V.E.V. own Inostics and Personal Genome Diagnostics stock, which is subject to certain restrictions under University policy. The terms of these arrangements are managed by the Johns Hopkins University in accordance with its conflict-of-interest policies.
Figures


Similar articles
-
Emergence of KRAS mutations and acquired resistance to anti-EGFR therapy in colorectal cancer.Nature. 2012 Jun 28;486(7404):532-6. doi: 10.1038/nature11156. Nature. 2012. PMID: 22722830 Free PMC article.
-
Phase II Study of Tivantinib and Cetuximab in Patients With KRAS Wild-type Metastatic Colorectal Cancer With Acquired Resistance to EGFR Inhibitors and Emergence of MET Overexpression: Lesson Learned for Future Trials With EGFR/MET Dual Inhibition.Clin Colorectal Cancer. 2019 Jun;18(2):125-132.e2. doi: 10.1016/j.clcc.2019.02.004. Epub 2019 Feb 14. Clin Colorectal Cancer. 2019. PMID: 30846365 Clinical Trial.
-
Broad RTK-_targeted therapy overcomes molecular heterogeneity-driven resistance to cetuximab via vectored immunoprophylaxis in colorectal cancer.Cancer Lett. 2016 Nov 1;382(1):32-43. doi: 10.1016/j.canlet.2016.08.022. Epub 2016 Aug 26. Cancer Lett. 2016. PMID: 27569653
-
Implications for KRAS status and EGFR-_targeted therapies in metastatic CRC.Nat Rev Clin Oncol. 2009 Sep;6(9):519-27. doi: 10.1038/nrclinonc.2009.111. Epub 2009 Jul 28. Nat Rev Clin Oncol. 2009. PMID: 19636327 Review.
-
Acquired resistance to EGFR-_targeted therapies in colorectal cancer.Mol Oncol. 2014 Sep 12;8(6):1084-94. doi: 10.1016/j.molonc.2014.05.003. Epub 2014 May 14. Mol Oncol. 2014. PMID: 24913799 Free PMC article. Review.
Cited by
-
Cell-free circulating tumor DNA in cancer.Chin J Cancer. 2016 Apr 7;35:36. doi: 10.1186/s40880-016-0092-4. Chin J Cancer. 2016. PMID: 27056366 Free PMC article. Review.
-
Detection of Somatic Mutations with ddPCR from Liquid Biopsy of Colorectal Cancer Patients.Genes (Basel). 2021 Feb 19;12(2):289. doi: 10.3390/genes12020289. Genes (Basel). 2021. PMID: 33669856 Free PMC article.
-
Engaging innate immunity for _targeting the epidermal growth factor receptor: Therapeutic options leveraging innate immunity versus adaptive immunity versus inhibition of signaling.Front Oncol. 2022 Sep 14;12:892212. doi: 10.3389/fonc.2022.892212. eCollection 2022. Front Oncol. 2022. PMID: 36185288 Free PMC article. Review.
-
MET nucleotide variations and amplification in advanced ovarian cancer: characteristics and outcomes with c-Met inhibitors.Oncoscience. 2013 Dec 11;1(1):5-13. doi: 10.18632/oncoscience.3. eCollection 2014. Oncoscience. 2013. PMID: 25593979 Free PMC article.
-
Liquid biopsy in lung cancer management.Rom J Morphol Embryol. 2022 Jan-Mar;63(1):31-38. doi: 10.47162/RJME.63.1.02. Rom J Morphol Embryol. 2022. PMID: 36074665 Free PMC article.
References
-
- Ciardiello F, Tortora G. EGFR antagonists in cancer treatment. N Engl J Med. 2008;358:1160–74. - PubMed
-
- Rothenberg ML, LaFleur B, Levy DE, Washington MK, Morgan-Meadows SL, Ramanathan RK, et al. Randomized phase II trial of the clinical and biological effects of two dose levels of gefitinib in patients with recurrent colorectal adenocarcinoma. J Clin Oncol. 2005;23:9265–74. - PubMed
-
- Santoro A, Comandone A, Rimassa L, Granetti C, Lorusso V, Oliva C, et al. A phase II randomized multicenter trial of gefitinib plus FOLFIRI and FOLFIRI alone in patients with metastatic colorectal cancer. Ann Oncol. 2008;19:1888–93. - PubMed
-
- Cunningham D, Humblet Y, Siena S, Khayat D, Bleiberg H, Santoro A, et al. Cetuximab monotherapy and cetuximab plus irinotecan in irinotecan-refractory metastatic colorectal cancer. N Engl J Med. 2004;351:337–45. - PubMed
Publication types
MeSH terms
Substances
Grants and funding
LinkOut - more resources
Full Text Sources
Other Literature Sources
Medical
Research Materials
Miscellaneous

