. 2013 Nov 21;155(5):1022-33.
doi: 10.1016/j.cell.2013.10.022.

A polymorphism in IRF4 affects human pigmentation through a tyrosinase-dependent MITF/TFAP2A pathway

Affiliations

A polymorphism in IRF4 affects human pigmentation through a tyrosinase-dependent MITF/TFAP2A pathway

Christian Praetorius et al. Cell. .

Abstract

Sequence polymorphisms linked to human diseases and phenotypes in genome-wide association studies often affect noncoding regions. A SNP within an intron of the gene encoding Interferon Regulatory Factor 4 (IRF4), a transcription factor with no known role in melanocyte biology, is strongly associated with sensitivity of skin to sun exposure, freckles, blue eyes, and brown hair color. Here, we demonstrate that this SNP lies within an enhancer of IRF4 transcription in melanocytes. The allele associated with this pigmentation phenotype impairs binding of the TFAP2A transcription factor that, together with the melanocyte master regulator MITF, regulates activity of the enhancer. Assays in zebrafish and mice reveal that IRF4 cooperates with MITF to activate expression of Tyrosinase (TYR), an essential enzyme in melanin synthesis. Our findings provide a clear example of a noncoding polymorphism that affects a phenotype by modulating a developmental gene regulatory network.


Conflict of interest statement

Conflicts of Interest

The authors declare that they have no conflict of interest.

Figures
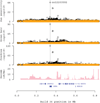
Figure 1
Figure 1
Association with pigmentation traits of variants in the IRF4 region (0–1Mb on chromosome 6) as determined by whole genome sequencing and imputation into SNP chip typed individuals. Black points show the unadjusted association values, yellow points show association values adjusted for the effect of rs12203592. The X axis is the genomic coordinate (hg18 Build 36). The Y axes are the association −log10 P values for Sun Sensitivity (yes/no, upper panel), Brown vs. Blond Hair Color (second panel), and Freckling (yes/no, third panel). The position of rs12203592 is indicated. The fourth panel shows the local recombination rates in cM/Mb. The lowest panel indicates the locations of known genes in the region, from UCSC. See also Table S1 and Figure S1.
Figure 2
Figure 2. rs12203592 disrupts a conserved melanocyte enhancer at IRF4
a) UCSC genome browser view of 25 KB region around IRF4 (hg19 coordinates chr6:388,750–413,750). DNase-seq signal (orange) in human epidermal melanocytes, Colo829, Mel 2183, and RPMI-7951 generated by ENCODE. b) Top: Graph shows IRF4 expression level as measured by ENCODE in 49 cell types (Duke Affymetrix exon arrays). Bottom: UCSC genome browser view of 25 KB region around IRF4 (hg19 coordinates chr6:388,750–413,750) in corresponding cell lines. Melanocyte-specific DNase HS peak overlapping rs12203592 labeled ‘M’; Lymphoid-specific DNase HS peaks labeled ‘L’; DNase HS overlapping the IRF4 promoter (labeled ‘P’). Cell types shown are (top to bottom) human epidermal melanocytes, Colo829, Mel 2183, GM12878, GM12891, GM12892, GM19238, GM19238, GM19240, GM18507, and CLL. c) UCSC genome browser view of 25 KB region around Irf4 (mm9 coordinates chr13:30,838,000–30,863,000). The ChIP-seq signals for EP300 (green) and H3K4me1 (blue) in the mouse melanocyte line melan-Ink4a-Arf from Gorkin et al., 2012.
Figure 3
Figure 3. Intron 4 of IRF4 drives expression in melanocytes
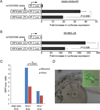
a–b) Results of the luciferase assays in melan-Ink4a-Arf and SK-MEL-28 cells. Pr=promoter; Luc=Luciferase reporter gene; IRF4 enh= 450 bp fragment from the 4th intron of IRF4 containing rs12203592. ‘IRF4 enh’ fragments are identical except for the base at position rs12203592 as indicated (‘C’ is the ancestral allele, ‘T’ is the derived allele). The X-axis shows fold luciferase activity relative to the minimal promoter alone, which is normalized to 1. P-values calculated by Kolmogorov–Smirnov test. The result is also highly significant by other non-parametric tests (P=0.007937 by Wilcoxon Rank-Sum test for both melan-Ink4a-Arf and SK-MEL-28), and by the standard parametric t-test (P=0.001686 for melan-Ink4a-Arf; P=0.01032 for SK-MEL-28). Each bar represents the average of five biological replicates per reporter construct. Error bars represent standard deviation. c) Reporter constructs containing either the rs12203592-C version of the IRF4 intron 4 element (IRF4) or the rs12203592-T version (IRF4snp) upstream of the GFP reporter after injection into zebrafish. The numbers represent the number of melanophores (blue) and embryos (red) seen to be positive for GFP. The difference between the melanophores containing the wild-type allele of intron 4 of IRF4 compared to the mutant allele (rs12203592) is statistically significant (p=0,0023, unpaired t-test). d) Image showing a GFP positive zebrafish embryo with a GFP positive melanophore in the inset.
Figure 4
Figure 4. MITF regulates expression of IRF4
a) The expression of the Mitf and Irf4 mRNAs is reduced in hearts from Mitfmi-vga9 mutant mice, as determined by qPCR analysis. Data are represented as mean +/− SEM. b) Expression of the MITF, IRF4, TFAP2a, DCT and TYR genes upon treatment with shRNA against MITF, IRF4, TFAP2A and negative control in 501mel melanoma cells as determined by qPCR analysis. Data are represented as mean +/− SEM. c) Western blot showing expression of the MITF, TFAP2A, IRF4 and β-actin proteins in 501mel cells after shRNA treatment. Intensity quantification is relative to actin loading control. See also Figure S2. d) Overexpression of the mouse Mitf (mMitf) cDNA (expressed from pcDNA3.1) in 501mel melanoma cells and in HEK293T embryonic kidney cells affects expression of the TYR and IRF4 mRNAs as assayed by RT-qPCR, whereas β-actin expression is unchanged. mMitf was detected with species-specific primers which only recognize the mouse Mitf gene. See also Figure S3.
Figure 5
Figure 5. MITF and TFAP2A affect IRF4 expression by binding regulatory elements in intron 4
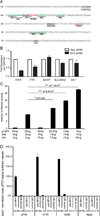
a) Schematic view of the IRF4 gene. The sequence shows comparison of MITF and TFAP2A binding sites in intron 4 of IRF4 between humans (H sap), gorilla (G gor), chimpanzee (P tro) and mouse (M mus). The location of the rs12203592 polymorphism is indicated. b) ChIP analysis of a GST-tagged MITF protein (a-GST AB) performed in 501mel cells. Primers specific for HSPA1B (neg. control), TYR (pos. control), and intron 4 of IRF4 are indicated. The GST-tagged Mitf only precipitated TYR and IRF4 sequences. c) ChIP analysis of TFAP2A in 501mel cells. PCR products specific for TGFA (pos. control), HSPA1B (neg. control) and intron 4 of IRF4 are shown. TFAP2A only precipitated TGFA and INT4 sequences. d) Gel shift analysis showing the binding of TFAP2A to the ancestral sequence (INT4-wt) in intron 4 of IRF4 (coordinates chr6: 396309–396333 in build GRCh37.p5 of the human genome) but not to the rs12203592-T sequence (INT4-RS) or to a completely mutated sequence (INT4-mut). e) Luciferase reporter assays performed in 501mel melanoma cells using intron 4 of IRF4 as a reporter. The ancestral IRF4 intron 4 sequence (intron 4, blue), the rs12203592-T polymorphic sequence (intron 4-rs), a sequence where all MITF binding sites were mutated (intron 4-3xE) and a sequence containing mutated MITF sites and the rs12203592-T polymorphism (intron 4-3xE+rs) were tested. The luciferase reporters were co-transfected with the wild type MITF and TFAP2A proteins and with a dominant negative version of MITF (MITFmi). Statistical analysis (p<0.0001) was done using unpaired t-test. Data are represented as mean +/− SEM. f) Cells homozygous for the ancestral allele (CC) express significantly higher levels of IRF4 than cells homozygous for the rs12203592-T polymorphism (TT). Fold expression data is represented relative to pooled mean TT expression +/− SEM. Statistical analysis was performed using analysis of variance (***, p < 0.001). g) A western blot showing expression of the IRF4 protein in melanocytes from CC and TT individuals. Intensity quantification is relative to GAPDH loading control. Note the decrease of basal IRF4 protein in the TT melanocyte cell lines. See also Figures S3–S5.
Figure 6
Figure 6. MITF and IRF4 regulate expression of TYR
a) Schematic view of the human TYR promoter showing the sequence of the MITF and potential IRF4 binding sites. b) Expression of IRF4, TYR, MATP, SLC24A5 and DCT as determined by qPCR, after treatment with siIRF4 or control siRNAs. Fold expression of each gene is represented relative to cells transfected with negative siRNA (arbitrarily set to 1). Data represent the mean ± range of two experiments using two primary melanocytes (QF1438 and QF1424). c) Luciferase reporter assay using wild-type TYR promoter as reporter construct and co-transfected with constructs expressing the MITF and IRF4 proteins. Statistical analysis was performed using the t-test; data are represented as average with the standard deviation. d) IRF4 binds the TYR locus. Chromatin immunoprecipitation real time PCR (ChIP-qPCR) analysis of IRF4 binding at sites proximal (around transcription start site; pTYR) and more distal (~1800 bp upstream of transcription start site; dTYR) to TYR coding region and other control loci in SK-MEL-28 melanoma cell line and in negative control OCI-Ly-19, a germinal center type B-cell lymphoma (GCB-DLBCL) cell line previously shown to lack IRF4 expression (Yang et al., 2012). Primer pair amplifying a region upstream of the SUB1 locus was used as a positive control, since this region showed strong IRF4 binding both in multiple myeloma (Shaffer et al., 2008), and activated B-cell type B-cell lymphoma (Yang et al., 2012) cell lines. NegA is a region on chromosome 7, used as a negative control for IRF4 binding, due to lack of observable IRF4 binding in previous studies with multiple myeloma and ABC-DLBCL cell lines. Error bars depict standard error of the mean. See also Figure S7.
Figure 7
Figure 7. IRF4 is involved in regulating pigmentation in mice
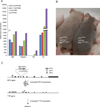
a) The expression plot shows presence and clear differences in the expression of Mitf, Tcfap2a, Irf4 and Tyr at different developmental time points, E15.5, E17.5, P1 and P7, measured in FPKM. Indicated expression levels of a transcript are proportional to the number of reads sequenced from that transcript after normalizing for respective transcript’s length. RNA from E15.5 embryos is shown in blue bars, E17.5 embryos in red, P1 pups in green and P7 in violet. b) Mice where Irf4 has been conditionally knocked out in heterozygotes for the semidominant MitfMi-Wh mutation. MitfMi-Wh heterozygotes which are simultaneously lacking Irf4 show lighter coat color (left) than mice which are wild type for Irf4 (right). c) Model depicting the relationship between MITF, TFAP2A and IRF4 in melanocytes and their effects on the expression of TYR. MITF and TFAP2A bind together to the intron 4 element in the IRF4 gene and regulate the expression of IRF4 from the upstream promoter. MITF and IRF4 then bind to and activate expression of TYR, leading to normal pigmentation. The rs12203592-T polymorphism leads to reduced IRF4 activation and thus reduced TYR expression which consequently leads to sun sensitivity and blue eyes.

Comment in

  • SNPing away at human skin color.
    Wallace MD, Box NF, Bond GL. Wallace MD, et al. Pigment Cell Melanoma Res. 2014 May;27(3):322-3. doi: 10.1111/pcmr.12229. Epub 2014 Mar 3. Pigment Cell Melanoma Res. 2014. PMID: 24517848 No abstract available.

Similar articles

Cited by

References

    1. Adachi S, Morii E, Kim D, Ogihara H, Jippo T, Ito A, Lee YM, Kitamura Y. Involvement of mi-transcription factor in expression of alpha-melanocyte-stimulating hormone receptor in cultured mast cells of mice. Journal of immunology. 2000;164:855–860. - PubMed
    1. Aoki H, Moro O. Involvement of microphthalmia-associated transcription factor (MITF) in expression of human melanocortin-1 receptor (MC1R) Life Sci. 2002;71:2171–2179. - PubMed
    1. Bastiaens M, ter Huurne J, Gruis N, Bergman W, Westendorp R, Vermeer BJ, Bouwes Bavinck JN. The melanocortin-1-receptor gene is the major freckle gene. Hum Mol Genet. 2001;10:1701–1708. - PubMed
    1. Beleza S, Johnson NA, Candille SI, Absher DM, Coram MA, Lopes J, Campos J, Araujo II, Anderson TM, Vilhjalmsson BJ, et al. Genetic architecture of skin and eye color in an African-European admixed population. PLoS Genet. 2013;9:e1003372. - PMC - PubMed
    1. Bertolotto C, Bille K, Ortonne JP, Ballotti R. Regulation of tyrosinase gene expression by cAMP in B16 melanoma cells involves two CATGTG motifs surrounding the TATA box: implication of the microphthalmia gene product. J Cell Biol. 1996;134:747–755. - PMC - PubMed

Publication types

Substances

  NODES
Association 8
Note 1
twitter 2