Review
. 2014 Jan 8;114(1):233-54.
doi: 10.1021/cr400161b. Epub 2013 Dec 5.

Retinoic acid actions through mammalian nuclear receptors

Affiliations
Review

Retinoic acid actions through mammalian nuclear receptors

Pengxiang Huang et al. Chem Rev. .
No abstract available


Figures

Figure 1
Figure 1
The NR family. Shown are the human NRs divided into multiple sub-families based on sequence alignments. Receptors in red are the high-affinity retinoic acid binding receptors.
Figure 2
Figure 2
The domains of NRs. (A) The protein architecture of NRs consist of a N-terminal A/B domain, a DNA binding domain (DBD), a hinge region, and a ligand-binding domain (LBD). (B) Illustration of how different portions of NRs interact in an RXR heterodimer, how the ligand, DNA and coactivator portions must further interact in a functional receptor complex.
Figure 3
Figure 3
Examples of some chemically diverse molecules that can act as RXR ligands. (A) The chemical structures of the molecules. (B) The solventaccessible molecular surfaces from the crystallographically observed structures of RXR/ligand complexes with each molecule. Coordinates are from PDB IDs: 1FBY, 1KDF (chain A), 1MV9, and 1MVC.
Figure 4
Figure 4
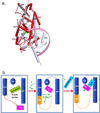
The ligand induced positioning of helix-12 into the “active conformation”. (A) the superposition of RXRα LBD in the apo-state (grey) and the same receptor in the holo-state (red) with 9-cis RA (green) in the pocket. The four arrows (pink) show the helical movements induced by ligand binding. (B) Illustration of how corepressors, ligand, and coactivators interact with a NR LBD. The blue box represents the LBD portion of NRs. The binding of RA molecules or other endogenous ligands or synthetic agonists results in a major repositioning of helix-12. Ligand binding releases corepressor binding, and causes helix-12 to trap the ligand, by closing on top of its pocket. The resulting active conformation also creates a groove for the binding of coactivator LLxxLL motifs on the surface of the LBD. The apo-RXRα is from PBD ID 1LBD, and the 9-cis RA complex is from PDB ID 1FBY.
Figure 5
Figure 5
RXR heterodimerization and DNA binding. (A-B) The interactions of RXR DBD and its partners (RAR or TR) on direct-repeat DNA response elements. RXR-RAR DBDs are shown on DR1 DNA, and RXR-TR DBDs are shown on DR4 DNA. Note that RXR occupies the upstream half-site in its complex with RAR, and the downstream half-site in its complex with TR. The RXR-RAR DBD complex is from PDB ID 1DSZ, and the RXR-PPAR DBD complex is from PDB ID 2NLL. B: The dimer interfaces that form between RXR LBD and other NR LBDs. Shown are the RXR-RAR (PDB ID 1XDK) and RXRLXR interfaces (PDB ID 3FAL). The regions in yellow indicate the protein-protein interfaces in these heterodimers. E. Structure of the intact RXRα-PPARγ complex on DR1 DNA (PDB ID 3E00). RXRα and PPARγ are in red and gold, respectively, with the DNA in green. The domains, ligand and coactivator peptide of RXR are labeled. In addition to the dimerization interfaces shown above, this complex also shows domain interactions involving the PPAR LBD and the RXR DBD.
Figure 5
Figure 5
RXR heterodimerization and DNA binding. (A-B) The interactions of RXR DBD and its partners (RAR or TR) on direct-repeat DNA response elements. RXR-RAR DBDs are shown on DR1 DNA, and RXR-TR DBDs are shown on DR4 DNA. Note that RXR occupies the upstream half-site in its complex with RAR, and the downstream half-site in its complex with TR. The RXR-RAR DBD complex is from PDB ID 1DSZ, and the RXR-PPAR DBD complex is from PDB ID 2NLL. B: The dimer interfaces that form between RXR LBD and other NR LBDs. Shown are the RXR-RAR (PDB ID 1XDK) and RXRLXR interfaces (PDB ID 3FAL). The regions in yellow indicate the protein-protein interfaces in these heterodimers. E. Structure of the intact RXRα-PPARγ complex on DR1 DNA (PDB ID 3E00). RXRα and PPARγ are in red and gold, respectively, with the DNA in green. The domains, ligand and coactivator peptide of RXR are labeled. In addition to the dimerization interfaces shown above, this complex also shows domain interactions involving the PPAR LBD and the RXR DBD.
Figure 6
Figure 6
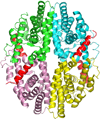
Structure of the RXRα LBD tetramer in the absence of ligand. The four subunits are shown in different colors, but in each case helix-12 is in red. Helix-12 from each subunit traverses to the adjacent subunit to occupy the groove normally reserved for coactivator LLxxLL motif binding. Coordinates are from PDB ID 1G1U.
Figure 7
Figure 7
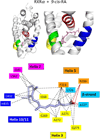
The binding location and specific interactions of 9-cis RA and all-trans RA inside (A) RXRα, (B) RARβ, (C) RARγ and (D) RORβ LBDs. Dotted lines indicate van der Walls contacts, and solid red lines indicated hydrogen bonding. Coordinates are from PDB ID 1FBY chain A, PDB ID 1XDK chain B, PDB ID 2LBD, and PDB ID 1N4H chain A.
Figure 7
Figure 7
The binding location and specific interactions of 9-cis RA and all-trans RA inside (A) RXRα, (B) RARβ, (C) RARγ and (D) RORβ LBDs. Dotted lines indicate van der Walls contacts, and solid red lines indicated hydrogen bonding. Coordinates are from PDB ID 1FBY chain A, PDB ID 1XDK chain B, PDB ID 2LBD, and PDB ID 1N4H chain A.
Figure 8
Figure 8
The degree of ligand burial inside the RAR, RXR and RORβ LBDs. (A–E): The LBDs are in white, the ligands in blue, helix 12 in each case is red, and the coactivator LLXXLL motifs is green. F. The solvent-accessible molecular surfaces from the LBD pockets surrounding 9-cis RA and all-trans RA in RARβ and RARγ, respectively. Coordinates for RARβ+9-cis RA are from PDB ID 1XDK chain B, for RARγ+9-cis RA are from PDB ID 3LBD human, for RARγ+ alltrans RA are from PDB ID 2LBD human, for RXRα+9-cis RA are from PDB ID 1FBY chain A, and for RORβ+ all-trans RA are from PDB ID 1N4H chain A.
Figure 9
Figure 9
The adaptability of RXR and RAR LBDs to synthetic ligands. (A–B) The comparison of RXRα LBD bound to 9-cis RA and the synthetic ligand (S)- 46a,b. PDB ID 1FBY and 1RDT. (C-D) The comparison of RARβ bound to 9- cis RA and TTNBP. PDB ID 1XDK and 4DM6. (E-F) The comparison of RARβ bound to all-trans RA and BMS184394. PDB ID 2LBD and 1FCX.
Figure 9
Figure 9
The adaptability of RXR and RAR LBDs to synthetic ligands. (A–B) The comparison of RXRα LBD bound to 9-cis RA and the synthetic ligand (S)- 46a,b. PDB ID 1FBY and 1RDT. (C-D) The comparison of RARβ bound to 9- cis RA and TTNBP. PDB ID 1XDK and 4DM6. (E-F) The comparison of RARβ bound to all-trans RA and BMS184394. PDB ID 2LBD and 1FCX.

Similar articles

Cited by

References

    1. Wolbach SB, Howe PR. J. Exp. Med. 1925;42:753. - PMC - PubMed
    1. McCollum EV, Davis M. J. Biol. Chem. 1913;15:167.
    1. Wald G. Nature. 1934;134:65.
    1. Bendich A, Olson JA. FASEB J. 1989;3:1927. - PubMed
    1. D'Ambrosio DN, Clugston RD, Blaner WS. Nutrients. 2011;3:63. - PMC - PubMed

Publication types

MeSH terms

  NODES
Note 2
twitter 2