Age-related decrease in the mitochondrial sirtuin deacetylase Sirt3 expression associated with ROS accumulation in the auditory cortex of the mimetic aging rat model
- PMID: 24505357
- PMCID: PMC3913718
- DOI: 10.1371/journal.pone.0088019
Age-related decrease in the mitochondrial sirtuin deacetylase Sirt3 expression associated with ROS accumulation in the auditory cortex of the mimetic aging rat model
Erratum in
- PLoS One. 2014;9(5):e98726
Abstract
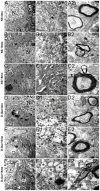
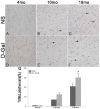
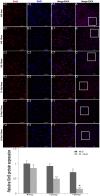
Age-related dysfunction of the central auditory system, also known as central presbycusis, can affect speech perception and sound localization. Understanding the pathogenesis of central presbycusis will help to develop novel approaches to prevent or treat this disease. In this study, the mechanisms of central presbycusis were investigated using a mimetic aging rat model induced by chronic injection of D-galactose (D-Gal). We showed that malondialdehyde (MDA) levels were increased and manganese superoxide dismutase (SOD2) activity was reduced in the auditory cortex in natural aging and D-Gal-induced mimetic aging rats. Furthermore, mitochondrial DNA (mtDNA) 4834 bp deletion, abnormal ultrastructure and cell apoptosis in the auditory cortex were also found in natural aging and D-Gal mimetic aging rats. Sirt3, a mitochondrial NAD+-dependent deacetylase, has been shown to play a crucial role in controlling cellular reactive oxygen species (ROS) homeostasis. However, the role of Sirt3 in the pathogenesis of age-related central auditory cortex deterioration is still unclear. Here, we showed that decreased Sirt3 expression might be associated with increased SOD2 acetylation, which negatively regulates SOD2 activity. Oxidative stress accumulation was likely the result of low SOD2 activity and a decline in ROS clearance. Our findings indicate that Sirt3 might play an essential role, via the mediation of SOD2, in central presbycusis and that manipulation of Sirt3 expression might provide a new approach to combat aging and oxidative stress-related diseases.
Conflict of interest statement
Figures


Similar articles
-
Age-related changes in mitochondrial antioxidant enzyme Trx2 and TXNIP-Trx2-ASK1 signal pathways in the auditory cortex of a mimetic aging rat model: changes to Trx2 in the auditory cortex.FEBS J. 2015 Jul;282(14):2758-74. doi: 10.1111/febs.13324. Epub 2015 Jun 10. FEBS J. 2015. PMID: 25996168
-
Age-related decline of the cytochrome c oxidase subunit expression in the auditory cortex of the mimetic aging rat model associated with the common deletion.Hear Res. 2012 Dec;294(1-2):40-8. doi: 10.1016/j.heares.2012.09.006. Epub 2012 Sep 27. Hear Res. 2012. PMID: 23022596
-
Age-associated decline in Nrf2 signaling and associated mtDNA damage may be involved in the degeneration of the auditory cortex: Implications for central presbycusis.Int J Mol Med. 2018 Dec;42(6):3371-3385. doi: 10.3892/ijmm.2018.3907. Epub 2018 Oct 1. Int J Mol Med. 2018. PMID: 30272261 Free PMC article.
-
SIRT3 regulation of mitochondrial oxidative stress.Exp Gerontol. 2013 Jul;48(7):634-9. doi: 10.1016/j.exger.2012.08.007. Epub 2012 Aug 31. Exp Gerontol. 2013. PMID: 22964489 Review.
-
NAD+ precursor modulates post-ischemic mitochondrial fragmentation and reactive oxygen species generation via SIRT3 dependent mechanisms.Exp Neurol. 2020 Mar;325:113144. doi: 10.1016/j.expneurol.2019.113144. Epub 2019 Dec 16. Exp Neurol. 2020. PMID: 31837320 Free PMC article. Review.
Cited by
-
Cocoa Polyphenol Extract Inhibits Cellular Senescence via Modulation of SIRT1 and SIRT3 in Auditory Cells.Nutrients. 2023 Jan 20;15(3):544. doi: 10.3390/nu15030544. Nutrients. 2023. PMID: 36771251 Free PMC article.
-
Metformin attenuates the D‑galactose‑induced aging process via the UPR through the AMPK/ERK1/2 signaling pathways.Int J Mol Med. 2020 Mar;45(3):715-730. doi: 10.3892/ijmm.2020.4453. Epub 2020 Jan 8. Int J Mol Med. 2020. PMID: 31922237 Free PMC article.
-
Protective Effect of Ginsenoside Rg1 on Hematopoietic Stem/Progenitor Cells through Attenuating Oxidative Stress and the Wnt/β-Catenin Signaling Pathway in a Mouse Model of d-Galactose-induced Aging.Int J Mol Sci. 2016 Jun 9;17(6):849. doi: 10.3390/ijms17060849. Int J Mol Sci. 2016. PMID: 27294914 Free PMC article.
-
Curcumin regulates autophagy through SIRT3-SOD2-ROS signaling pathway to improve quadriceps femoris muscle atrophy in KOA rat model.Sci Rep. 2024 Apr 8;14(1):8176. doi: 10.1038/s41598-024-58375-2. Sci Rep. 2024. PMID: 38589505 Free PMC article.
-
SIRT3-SOD2-mROS-dependent autophagy in cadmium-induced hepatotoxicity and salvage by melatonin.Autophagy. 2015;11(7):1037-51. doi: 10.1080/15548627.2015.1052208. Autophagy. 2015. PMID: 26120888 Free PMC article.
References
Publication types
MeSH terms
Substances
Grants and funding
LinkOut - more resources
Full Text Sources
Other Literature Sources
Medical
Molecular Biology Databases

