. 2014 Apr 4;289(14):9795-810.
doi: 10.1074/jbc.M113.527150. Epub 2014 Feb 7.

FGF-23 is a negative regulator of prenatal and postnatal erythropoiesis

Affiliations

FGF-23 is a negative regulator of prenatal and postnatal erythropoiesis

Lindsay M Coe et al. J Biol Chem. .

Abstract

Abnormal blood cell production is associated with chronic kidney disease (CKD) and cardiovascular disease (CVD). Bone-derived FGF-23 (fibroblast growth factor-23) regulates phosphate homeostasis and bone mineralization. Genetic deletion of Fgf-23 in mice (Fgf-23(-/-)) results in hypervitaminosis D, abnormal mineral metabolism, and reduced lymphatic organ size. Elevated FGF-23 levels are linked to CKD and greater risk of CVD, left ventricular hypertrophy, and mortality in dialysis patients. However, whether FGF-23 is involved in the regulation of erythropoiesis is unknown. Here we report that loss of FGF-23 results in increased hematopoietic stem cell frequency associated with increased erythropoiesis in peripheral blood and bone marrow in young adult mice. In particular, these hematopoietic changes are also detected in fetal livers, suggesting that they are not the result of altered bone marrow niche alone. Most importantly, administration of FGF-23 in wild-type mice results in a rapid decrease in erythropoiesis. Finally, we show that the effect of FGF-23 on erythropoiesis is independent of the high vitamin D levels in these mice. Our studies suggest a novel role for FGF-23 in erythrocyte production and differentiation and suggest that elevated FGF-23 levels contribute to the pathogenesis of anemia in patients with CKD and CVD.

Keywords: Anemia; Bone; Bone Marrow; Erythrocyte; Erythropoeisis; FGF-23; Hematopoiesis; Kidney.


Figures

FIGURE 1.
FIGURE 1.
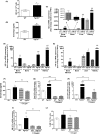
Erythroid cells express Fgf-23 signaling components. Quantitative real time RT-PCR show changes in Fgf-23, klotho, and FGFR1–4 mRNA expression in isolated Ter119+ erythroid cells from WT BM (n = 8–9). The data are represented as mean fold change ± S.E. relative to housekeeping gene HPRT.
FIGURE 2.
FIGURE 2.
Peripheral blood complete blood count analysis of 6-week-old WT (n = 15), heterozygous (Fgf-23+/−, n = 5), and Fgf-23 null (Fgf-23−/−, n = 15) mice. A, RBC counts. B, RBC distribution width (RDW). C, mean cell volume (MCV). D, mean corpuscular (cell) hemoglobin (MCH). **, p < 0.01; ***, p < 0.001; ****, p < 0.0001.
FIGURE 3.
FIGURE 3.
Flow cytometry analysis of peripheral blood and bone marrow from 6-week-old WT and Fgf-23−/− mice. A, representative FACS dot plots illustrating different RBC populations. PB and BM cells from WT and Fgf-23−/− mice are stained for Ter119 and CD71 for erythroid cells. B and C, peripheral blood. B, percentage of primitive pro-erythroblasts (pro-E) stained positive for Ter119med and CD71high (WT, n = 6; Fgf-23−/−, n = 7). C, percentage of mature erythroid cells stained positive for Ter119 (WT, n = 9; Fgf-23−/−, n = 11). D and E, bone marrow. D, percentage of primitive pro-erythroblasts (pro-E) stained positive for Ter119med (WT, n = 7; Fgf-23−/−, n = 8). E, percentage of mature erythroid cells stained positive for Ter119 and CD71 (WT, n = 15; Fgf-23−/−, n = 13). The data are represented as means ± S.E. *, p < 0.05; **, p < 0.01.
FIGURE 4.
FIGURE 4.
Increased erythropoiesis in Fgf-23−/− mice. A, colony-forming assay for erythroid (BFU-E) progenitors (WT, n = 5; Fgf-23−/−, n = 12). Cells from each mouse were plated in duplicate, and the number of colonies in each plate was counted. B, Epo concentrations measured by ELISA in serum of WT (n = 12) and Fgf-23−/− mice (n = 8). Samples were measured in duplicate. C, quantitative real time RT-PCR showing changes in Epo mRNA expression in bone marrow (WT, n = 7; Fgf-23−/−, n = 5), bone (inset) (WT, n = 5; Fgf-23−/−, n = 6), liver (WT, n = 7; Fgf-23−/−, n = 7), and kidney (WT, n = 7; Fgf-23−/−, n = 6) in WT and Fgf-23−/− mice. Bone graph is amplified in the inset because of small values compared with other tissues. D and E, quantitative real time RT-PCR showing changes in HIF-1α (D) and HIF-2α (E) mRNA expression in bone marrow, bone, liver, and kidney in WT and Fgf-23−/− mice (WT, n = 7; Fgf-23−/−, n = 7). F–J, oxygen treatment. WT (n = 4) and Fgf-23−/− (n = 5) mice were subjected to 100% oxygen at 4 liters/min for 1 h. F, Epo concentrations measured by ELISA in serum of WT (n = 4) and Fgf-23−/− mice (n = 5). Samples were measured in duplicate. G–I, quantitative real time RT-PCR showing changes in renal HIF-1α (G), renal EPO (H), and BM HIF-1α mRNA expression (I) in WT and Fgf-23−/− mice (WT, n = 4; Fgf-23−/−, n = 5). J, flow cytometry analysis of bone marrow from 6-week-old WT and Fgf-23−/− mice with or without oxygen treatment. A percentage of mature erythroid cells stained positive for Ter119 (WT, n = 4; Fgf-23−/−, n = 5). The data are represented as mean fold change ± S.E. relative to housekeeping gene HPRT. *, p < 0.05; **, p < 0.01; ***, p < 0.001.
FIGURE 5.
FIGURE 5.
Lack of Fgf-23 results in up-regulation of HIF _target genes. A–D, quantitative real time RT-PCR showing changes in liver transferrin (A, WT, n = 6; Fgf-23−/−, n = 5), transferrin receptor (B, WT, n = 6; Fgf-23−/−, n = 5), glucose transporter-1 (C, WT, n = 6; Fgf-23−/−, n = 5), and phosphoglycerate kinase-1 (D, WT, n = 6; Fgf-23−/−, n = 5) mRNA expression in WT and Fgf-23−/− mice. E–H, quantitative real time RT-PCR showing changes in bone marrow transferrin (E, WT, n = 6; Fgf-23−/−, n = 6), transferrin receptor (F, WT, n = 6; Fgf-23−/−, n = 6), glucose transporter-1 (G, WT, n = 6; Fgf-23−/−, n = 6), and phosphoglycerate kinase-1 (H, WT, n = 5; Fgf-23−/−, n = 5) mRNA expression in WT and Fgf-23−/− mice. The data are represented as mean fold change ± S.E. relative to housekeeping gene HPRT. *, p < 0.05; **, p < 0.01; ***, p < 0.001; ****, p < 0.0001.
FIGURE 6.
FIGURE 6.
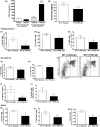
Flow cytometry analysis of HSC populations in peripheral blood and bone marrow from 6-week-old WT and Fgf-23−/− mice. A, percentage of HSC population in peripheral blood stained for SLAM (CD150+CD48) (WT, n = 7; Fgf-23−/−, n = 10). B, percentage of HSC population in bone marrow stained for SLAM (CD150+CD48) (WT, n = 6; Fgf-23−/−, n = 11). C, percentage of HSC population undergoing apoptosis in the bone marrow stained for SLAM (CD150+CD48) and annexin V (WT, n = 6; Fgf-23−/−, n = 11). D, colony-forming assay for granulocyte-erythrocyte-monocyte-megakaryocyte (CFU-GEMM) progenitors (WT, n = 5; Fgf-23−/−, n = 12). Cells from each mouse were plated in duplicate, and the number of colonies in each plate was counted. The data are represented as means ± S.E. *, p < 0.05.
FIGURE 7.
FIGURE 7.
Migration and homing of Fgf-23−/− bone marrow cells. A, SDF-1α concentration measured by ELISA in serum of WT (n = 9) and Fgf-23−/− mice (n = 8). Samples were measured in duplicate. B, in vitro migration experiment revealed no change in migratory capacity of Fgf-23−/− BM cells toward an SDF-1 gradient (WT, n = 18; Fgf-23−/−, n = 14). C, adherence assay showed no changes in Fgf-23−/− BM cells to adhere to fibronectin (WT, n = 10; Fgf-23−/−, n = 9). D, graphic representation of flow cytometry analysis of peripheral blood, bone marrow, and spleen (SPL) after transplantation of WT or Fgf-23−/− BM cells in irradiated B6.SJL recipient mice (WT, n = 10; Fgf-23−/−, n = 11). E–G, flow cytometry profile of peripheral blood, bone marrow, and spleen after transplantation. The data are represented as means ± S.E. *, p < 0.05; **, p < 0.01; ***, p < 0.001.
FIGURE 8.
FIGURE 8.
Flow cytometry analysis and colony-forming assays of spleens from 6 week old WT and Fgf-23−/− mice. A and B, flow cytometry. A, percentage of early erythroid cells (pro-E) stained positive for Ter119med and CD71high (WT, n = 6; Fgf-23−/−, n = 9). B, percentage of mature erythroid cells stained positive for Ter119 (WT, n = 6; Fgf-23−/−, n = 7). C, colony-forming assay for erythroid (BFU-E) progenitors (WT, n = 7; Fgf-23−/−, n = 8). Cells from each mouse were plated in duplicate, and the number of colonies in each plate was counted. D and E, flow cytometry. D, percentage of HSC population stained for SLAM (CD150+CD48) (WT, n = 8; Fgf-23−/−, n = 5). E, percentage of HSC population stained for LSK (Sca-1 FITC (Ly6A-E), c-Kit Percp Cy5.5 (CD117), and APC-tagged lineage mixture comprising of antibodies against CD3, B220 (CD45R), Ly6G and Ly6C (Gr-1), CD11b (Mac-1), and TER119. c-Kit+Sca1+ cells were gated on lineage negative fraction to analyze LSK (Linc-Kit+Sca1+). The data are represented as means ± S.E. *, p < 0.05; **, p < 0.01.
FIGURE 9.
FIGURE 9.
Flow cytometry analysis and colony-forming assays of fetal liver cells from E15.5 WT and Fgf-23−/− mice. A and B, flow cytometry. A, percentage of mature erythroid cells stained positive for Ter119 (WT, n = 8; Fgf-23−/−, n = 8). B, colony-forming assay for erythroid (BFU-E) progenitors (WT, n = 10; Fgf-23−/−, n = 10). Cells from each mouse were plated in duplicate, and the number of colonies in each plate was counted. C, percentage of HSC population stained for SLAM (CD150+CD48) (WT, n = 7; Fgf-23−/−, n = 8). D, representative flow cytometry dot plot showing CD150+CD48 populations in WT and Fgf-23−/− mice. E, percentage of HSC population stained for LSK (LinSca-1+c-Kit+) (WT, n = 9; Fgf-23−/−, n = 10). F, representative flow cytometry dot plot showing LSK populations in WT and Fgf-23−/− mice. G, percentage of HSC population stained for KTLS (c-Kit+Thy1+LinSca-1+) (WT, n = 9; Fgf-23−/−, n = 10). The data are represented as means ± S.E. *, p < 0.05; **, p < 0.01.
FIGURE 10.
FIGURE 10.
FGF-23 injections. A, serum FGF-23 concentrations measured by ELISA pre- and postintraperitoneal injections of recombinant human FGF-23 in WT mice. Vehicle-treated mice were injected with PBS (n = 6 per group). B, Epo concentrations measured by ELISA in serum of WT mice injected with FGF-23 (5 μg) or vehicle (PBS). Samples were measured in duplicate. C–M, flow cytometry analysis and colony-forming assays of hematopoietic populations in FGF-23- and vehicle-treated WT mice. C–E, peripheral blood. C, percentage of early erythroid cells (pro-E) stained positive for Ter119med and CD71high. D, percentage of mature erythroid cells stained positive for Ter119. E, percentage of HSC population stained for LSK (LinSca-1+c-Kit+). F–H, bone marrow. F, percentage of early erythroid cells (pro-E) stained positive for Ter119 and CD71high. G, percentage of mature erythroid cells stained positive for Ter119. H, representative dot plot of flow cytometry analysis of WT and Fgf-23−/− pro-E and Ter119+ cell populations in BM. I, colony forming assay for erythroid (BFU-E) progenitors. Cells from each mouse were plated in triplicate, and the number of colonies in each plate was counted. (n = 6 per group). J, percentage of HSC population stained for SLAM (CD150+CD48). K–M, spleen. K, percentage of early erythroid cells (pro-E) stained positive for Ter119med and CD71high. L, percentage of mature erythroid cells stained positive for Ter119. M, percentage of HSC population stained for KTLS (LinSca-1+c-Kit+Thy-1+). The data are represented as means ± S.E. *, p < 0.05.
FIGURE 11.
FIGURE 11.
In vitro FGF-23 protein treatment of isolated BM Ter119+ cells normalizes erythropoiesis in Fgf-23−/− mice (n = 3 per group). Cells from each mouse were cultured in triplicate. A, percentage of mature erythroid cells stained positive for Ter119. B, percentage of mature erythroid cells stained positive for Ter119 and Epo-R. C and D, quantitative real time RT-PCR showing mRNA levels of Epo (C) and HIF-2α (D) in WT and Fgf-23−/− Ter119+ cells with or without FGF-23 protein treatment. The data are represented as mean fold change ± S.E. relative to housekeeping gene HPRT. *, p < 0.05; **, p < 0.01.
FIGURE 12.
FIGURE 12.
Deletion of vitamin D rescues the hematopoietic phenotype of Fgf-23−/− mice. A–D, peripheral blood complete blood count analysis of 6-week-old WT, Fgf-23−/−, Fgf-23−/−/1α(OH)ase−/−, and 1α(OH)ase−/− mice. A, RBC counts (WT, n = 21; Fgf-23−/−, n = 6; Fgf-23−/−/1α(OH)ase−/−, n = 8; and 1α(OH)ase−/− n = 13). B, percentage of primitive pro-E-stained positive for Ter119med and CD71high (WT, n = 4; Fgf-23−/−, n = 4; Fgf-23−/−/1α(OH)ase−/− n = 5; and 1α(OH)ase−/− n = 9). C, percentage of mature erythroid cells stained positive for Ter119 and CD71low (Ery-C fraction) (WT, n = 8; Fgf-23−/−, n = 7; Fgf-23−/−/1α(OH)ase−/− n = 6; and 1α(OH)ase−/− n = 7). D, percentage of HSC population stained for SLAM (CD150+CD48) (WT, n = 7; Fgf-23−/−, n = 9; Fgf-23−/−/1α(OH)ase−/− n = 7; and 1α(OH)ase−/− n = 8). E and F, FGF-23 injections. E, percentage of primitive pro-erythroblasts (pro-E) stained positive for Ter119med and CD71high (WT, n = 5; Fgf-23−/−, n = 6; Fgf-23−/−/1α(OH)ase−/− n = 3; and 1α(OH)ase−/− n = 3). F, percentage of mature erythroid cells stained positive for Ter119 (WT, n = 7; 1α(OH)ase−/− n = 12; WT+FGF-23, n = 6; 1α(OH)ase−/− + FGF-23, n = 3). The data are represented as means ± S.E. *, p < 0.05; **, p < 0.01; ***, p < 0.001; ****, p < 0.0001 compared with WT; #, p < 0.05 compared with fgf-23−/−; ##, p < 0.01 compared with fgf-23−/−; $, p < 0.05 compared with fgf-23−/−/1α(OH)ase−/−; $$, p < 0.01 compared with fgf-23−/−/1α(OH)ase−/−.
FIGURE 13.
FIGURE 13.
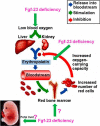
Proposed model showing the mechanism of Fgf-23 actions on erythropoiesis.

Similar articles

Cited by

References

    1. Christensen J. L., Wright D. E., Wagers A. J., Weissman I. L. (2004) Circulation and chemotaxis of fetal hematopoietic stem cells. PLoS Biol. 2, E75. - PMC - PubMed
    1. Dzierzak E., Speck N. A. (2008) Of lineage and legacy: the development of mammalian hematopoietic stem cells. Nat. Immunol. 9, 129–136 - PMC - PubMed
    1. Sugiyama D., Inoue-Yokoo T., Fraser S. T., Kulkeaw K., Mizuochi C., Horio Y. (2011) Embryonic regulation of the mouse hematopoietic niche. ScientificWorldJournal 11, 1770–1780 - PMC - PubMed
    1. Lipkin G. W., Kendall R. G., Russon L. J., Turney J. H., Norfolk D. R., Brownjohn A. M. (1990) Erythropoietin deficiency in acute renal failure. Nephrol. Dial. Transplant. 5, 920–922 - PubMed
    1. Zhang F., Laneuville P., Gagnon R. F., Morin B., Brox A. G. (1996) Effect of chronic renal failure on the expression of erythropoietin message in a murine model. Exp. Hematol. 24, 1469–1474 - PubMed

Publication types

MeSH terms

LinkOut - more resources

  NODES
admin 1
Association 2
twitter 2