. 2014 Mar 19;34(12):4345-63.
doi: 10.1523/JNEUROSCI.4954-13.2014.

Cortical neuron response properties are related to lesion extent and behavioral recovery after sensory loss from spinal cord injury in monkeys

Affiliations

Cortical neuron response properties are related to lesion extent and behavioral recovery after sensory loss from spinal cord injury in monkeys

Hui-Xin Qi et al. J Neurosci. .

Abstract

Lesions of the dorsal columns at a mid-cervical level render the hand representation of the contralateral primary somatosensory cortex (area 3b) unresponsive. Over weeks of recovery, most of this cortex becomes responsive to touch on the hand. Determining functional properties of neurons within the hand representation is critical to understanding the neural basis of this adaptive plasticity. Here, we recorded neural activity across the hand representation of area 3b with a 100-electrode array and compared results from owl monkeys and squirrel monkeys 5-10 weeks after lesions with controls. Even after extensive lesions, performance on reach-to-grasp tasks returned to prelesion levels, and hand touches activated territories mainly within expected cortical locations. However, some digit representations were abnormal, such that receptive fields of presumably reactivated neurons were larger and more often involved discontinuous parts of the hand compared with controls. Hand stimulation evoked similar neuronal firing rates in lesion and control monkeys. By assessing the same monkeys with multiple measures, we determined that properties of neurons in area 3b were highly correlated with both the lesion severity and the impairment of hand use. We propose that the reactivation of neurons with near-normal response properties and the recovery of near-normal somatotopy likely supported the recovery of hand use. Given the near-completeness of the more extensive dorsal column lesions we studied, we suggest that alternate spinal afferents, in addition to the few spared primary axon afferents in the dorsal columns, likely have a major role in the reactivation pattern and return of function.

Keywords: area 3b; dorsal column lesion; multielectrode array; primate; somatotopy; tactile.


Figures

Figure 1.
Figure 1.
Schematic drawings show extents and locations of dorsal column lesions in five monkeys. A coronal view of the lesion site was reconstructed from the series of horizontally cut spinal cord sections projected into a transverse view. Black shadings represent the extent of damaged tissue; gray shadings represent surrounding affected zones. C4–C7, Spinal cord cervical segments 4–7; L, left; R, right.
Figure 2.
Figure 2.
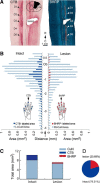
Estimation of lesion extent in Monkey SM-G. A, Photomicrographs from horizontally cut spinal cord sections reveal the extent and level of dorsal column lesion. Arrowheads point to CTB label (Intact) and BHRP-label (Lesion). Inset, Transverse view of spinal cord at C6 with the extent of lesion (black shading) for SM-G. B, Bar graphs contrast the areas of tracer uptake with the area of the cuneate nucleus. Distance (mm) measured from the beginning of the obex is on the x-axis. Negative values show distance caudal to obex. The y-axis depicts the areal size for each section through the cuneate nucleus. Dots on the schematic drawings of hands indicate injection sites. C, Bar graph represents ratios of labeled area to total area of cuneate nucleus on each side. D, Pie graph represents the final estimated proportion of lesion area (20.69%) for SM-G. C4–C7, Cervical spinal cord segments 4–7; C, caudal; CuN, cuneate nucleus of the brainstem; D1–D5, digits 1–5; R, rostral.
Figure 3.
Figure 3.
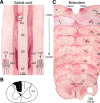
Terminations of peripheral afferents in the dorsal horn of the spinal cord and cuneate nucleus of the brainstem labeled by injections of CTB into the distal and middle phalanges of digits 3 and 4 of Monkey OM-M. A, A horizontally cut CTB-immunoreacted section of the spinal cord showing the location of lesion and foci of labeled terminal fields (indicated by arrowheads) after tracer injection. Red dots on the schematic drawings of hands (inset) indicate injection sites. Dashed line indicates the midline of the spinal cord. B, Drawing shows the extent of lesion (shaded in black) in the dorsal column. Lesion was reconstructed from horizontally cut immunoreacted spinal cord sections to reveal CTB tracer. Dashed line indicates the posterior fissure of the spinal cord, which separates cuneate fasciculus from gracile fasciculus. C, A series of coronally cut CTB-immunoreacted sections through dorsal column nuclei of brainstem. The cuneate nucleus is outlined on both sides. There are only a few detectable foci of axon fibers on the lesion side (arrowheads). Each section is labeled with the series section number. C4–C7, Cervical spinal cord segments 4–7; CuN, cuneate nucleus of brainstem; D3, digit 3; D4, 4.
Figure 4.
Figure 4.
Bar graphs showing anatomical results from four lesion monkeys with subcutaneous CTB injections into digits of both hands. Distance (mm) measured from the beginning of the obex is on the x-axis. Negative values show distance caudal to obex. The y-axis depicts the areal size (mm2) of the combined foci of CTB label for each section through the cuneate nucleus of the brainstem. Values from the intact and lesion sides are compared, with the resulting proportion in parentheses, for 4 of the 5 lesion cases in A–D.
Figure 5.
Figure 5.
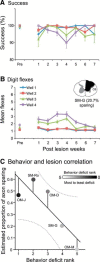
Example of behavioral recovery measures from Monkey SM-G and summary of relationships between lesion extent and behavior deficits for all cases. A, Success scores (mean ± SEM) from Monkey SM-G performing a reach-to-grasp task. Line graphs represent postlesion changes in success score from 4 testing wells of increasing depth/difficulties, in which the well 1 (blue) is the easiest and well 4 (violet) is the most difficult. B, Number of digit flexes per successful trial (mean ± SEM) from Monkey SM-G performing a reach-to-grasp task from the 4 testing wells Inset, Transverse view of spinal cord at cervical level 6 (C6) with the extent of lesion (black shading) for SM-G reconstructed from a series of horizontally cut spinal cord sections with the estimated axon sparing included for reference. C, Estimated proportion of axons spared (y-axis) versus the behavior deficit rank (x-axis) plotted for the 5 monkeys with dorsal column lesions shows a strong relationship between lesion extents and deficits using the impaired arm and hand. Dashed lines indicate 95% confidence intervals based on the predicted mean linear regression fit line, shown as a solid line (y = 0.75 − 0.13x, R2 = 0.731). Each lesion case (n = 5) is represented by a gray circle and numbered by behavioral deficit ranking from most impaired (5, light gray) to least (1, dark gray).
Figure 6.
Figure 6.
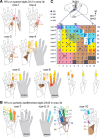
Organization of the hand representation of deafferented area 3b in Monkey OM-M 5 weeks after lesion. A, Schematic drawings of hands represent neuronal RFs progressively shifted from distal to proximal portions of the hand, from the rostral to caudal direction of the array (rows 1–10) in the right hemisphere area 3b. B, Top, Schematic drawing of OM brain to show the location of the electrode array (square). Bottom, Somatotopic map was reconstructed based on the locations of RFs for neurons at each electrode. The lateral portion of the cortex representing digits 1 and 2 was mostly unresponsive. However, even with <1% of afferents spared in the cuneate nucleus, digit representations 3–5 responded well, and somatotopy was similar to that of normal monkeys. Nevertheless, unusually large RFs and over-represented dorsal hairy skin suggest abnormalities in area 3b. Solid dots indicate responses ranging from good to excellent at a given electrode; open circles represent weak responses; x indicates microelectrode penetrations with no responses; “-” indicates disabled electrodes (in which recordings were turned off because of high levels of noise). Dashed lines indicate the rostral and caudal borders of area 3b defined by topography and myelin architecture. 3a, Area 3a; 3b, area 3b; D3, D4, and D5, digits 3, 4, and 5, respectively; GR, good response; LS, lateral sulcus; M, medial; NR, no response; P, palm; R, rostral; STS, superior temporal sulcus; WR, weak response. A, Numbers indicate channel numbers.
Figure 7.
Figure 7.
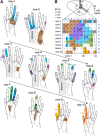
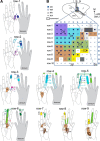
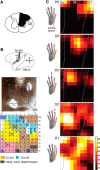
Organization of the hand representation of deafferented area 3b in Monkey SM-G 6 weeks after lesion. A, Schematic drawings of hands represent neuronal RFs in largely spared digits 1 and 2 representations of area 3b. Distal to proximal representations of individual digits mapped onto the rostrocaudal orientation of the array (rows 1–10) in the left hemisphere area 3b. RF sizes within D1 and D2 representations were usually small (i.e., first 5 rows). B, Schematic drawings of hands represent neuronal RFs in deafferented digit representations 3–5 of area 3b. RFs in this region were much larger and included multiple phalanges, multiple digits, or both glabrous and dorsal skin (e.g., electrodes 55, 63, 64, 66, 84, 85, 87, and 92, etc.). C, Top, Schematic drawing of a SM brain illustrates the location of electrode array (square). Bottom, Somatotopic map was reconstructed based on the locations of RFs for neurons at each electrode. The map demonstrates that digits 1–5 are organized in the expected lateromedial progression, but the representations of D1 and D2 appear to be much larger than those of D3–D5. Solid dots indicate responses ranging from good to excellent at a given electrode; open circles represent weak responses; x indicates microelectrode penetrations with no responses; “-” indicates disabled electrodes. Dashed lines indicate the rostral and caudal borders of area 3b defined by topography and myelin architecture. 1, 3a, and 3b, Areas 1, 3a, and 3b; CS, central sulcus; D1–D5, digits 1–5, respectively; GR, good response; LS, lateral sulcus; M, medial; NR, no response; P, palm; R, rostral; STS, superior temporal sulcus; WR, weak response. A, Numbers indicate electrode numbers.
Figure 8.
Figure 8.
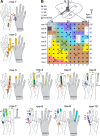
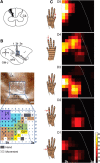
Organization of digit representations of partially deafferented somatosensory area 3b in Monkey OM-J 10 weeks after unilateral dorsal column lesion. A, Schematic drawings of hands depict neuronal RFs progressively shifted from distal to proximal portions of the hand when electrodes were mapped across the rostrocaudal direction (rows 1–10) in area 3b (right hemisphere). B, Top, Schematic drawing of an OM brain to illustrate the location of electrode array (square). Bottom, Somatotopic map was reconstructed based on locations of RFs for neurons at each electrode. The lateral portion of the cortex representing digit 1 was unresponsive, but digits 2–5 were represented with somatotopy similar to normal monkeys. However, discontinuous RFs were found in multiple locations (e.g., electrodes 17, 27, and 56). Conventions follow Figures 6 and 7.
Figure 9.
Figure 9.
Organization of digit representations of partially deafferented somatosensory area 3b in Monkey OM-D 7 weeks after unilateral dorsal column lesion. A, Neuronal RFs progressively shifted from distal to proximal portions of the hand when electrodes (rows 1–10) were mapped from the rostrocaudal direction in area 3b (right hemisphere). B, Top, Schematic drawing of an OM brain to show the location of electrode array (square). Bottom, Somatotopic map was reconstructed based on locations of RFs for neurons at each electrode. With ∼50% of spared fibers reaching the cuneate nucleus, the somatotopy, responsiveness, and the RF sizes resembled those of normal monkeys. Conventions follow Figures 6 and 7.
Figure 10.
Figure 10.
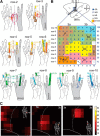
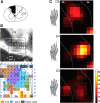
Organization of the hand representation of area 3b in a normal Monkey OM-A. A, Schematic drawings of hands represent neuronal RFs progressively shifted from distal to proximal portions of the hand, from the rostral to caudal direction of the array (rows 1–10) in the left hemisphere area 3b hand region. B, Top, Schematic drawing of OM brain representing the location of the electrode array (square). Bottom, Somatotopic map was reconstructed based on the locations of RFs for neurons at each electrode. Conventions follow Figures 6 and 7. The somatotopy was similar to that of previous reports from normal monkeys. C, Heat maps of the peak firing rate responses (50 ms response windows) across the array were generated in MATLAB with an averaging filter (size = 3) and hot colors representing higher peak firing rates (color scale 5–85 spikes/s). Dashed lines indicate rostral and caudal borders of area 3b. Peak firing rate responses were represented in expected somatotopic order. Visualization is an average map in which the firing of neurons from points surrounding each square contribute to the color code (filter size = 3) rather than a point-to-point match for all neurons recorded from each electrode. Inset (into each heat map), Schematics of the OM hand represent tactile stimulation sites (red dot) on individual digits (arrow).
Figure 11.
Figure 11.
Responsiveness in partially deprived area 3b in Monkey OM-M. A, A transverse view of spinal cord showing the extent of lesion (black shading) reconstructed from a series of horizontally cut spinal cord sections. B, Photomicrograph from a myelin-stained section cut parallel to pia surface through somatosensory areas 3b and 1 representing the array location (top) and a schematic drawing representing a reconstructed somatotopic map from array (bottom). D12 indicates a mix of responses from digits 1 and 2. D3–5 indicates a mix of responses from digits 3–5. C, Heat maps follow conventions of Figure 10 to show peak firing responses across the array, with hot colors representing higher peak firing rates (color scale 5–85 spikes/s). Schematic drawings of OM hands after extensive deafferentation represent the sites for tactile stimulation (red dots with arrows) on individual digits. Peak firing rate activations in response to digit stimulation are relatively weak but are generally consistent with digit territories determined from RF mapping. Dashed lines indicate the rostral and caudal borders of area 3b defined by topography and myelin architecture. Conventions follow Figures 6 and 7.
Figure 12.
Figure 12.
Responsiveness in partially deprived area 3b in Monkey SM-G. A, A transverse view of spinal cord showing the extent of lesion (black shading) reconstructed from a series of horizontally cut spinal cord sections. B, Top, Schematic drawing represents an overview of a SM brain. The array location is indicated by a box. Middle, Photomicrograph from a myelin-stained section cut parallel to pia surface through somatosensory areas 3a, 3b, and 1 showing the array location. Bottom, Schematic drawing of a reconstructed somatotopic map. C, Heat maps of the peak firing rate responses across the array follow conventions of Figures 10 and 11 (color scale 5–85 spikes/s). Schematic drawings of SM hands represent the sites for tactile stimulation (red dots with arrows) on individual digits. Peak firing rate responses in mostly spared territories of D1 and D2 were strong and extensive, and digits were represented in expected somatotopic order; however, electrodes in deprived representations (e.g., D4 and D5) recorded neurons responding strongly to stimulation on D1 and D2. B, “x” indicates no response to light to moderate touch during minimal RF mapping but does not preclude the possibility of driven activity under the suprathreshold stimulation conditions using the computer-controlled mechanical probe or high levels of spontaneous activity. C, Average maps in which the firing of neurons from points surrounding each square contribute to the color code (filter size = 3) rather than a point-to-point match for all neurons recorded from each electrode. Dashed lines indicate rostral and caudal borders of area 3b.
Figure 13.
Figure 13.
Responsiveness in partially deprived area 3b in Monkey OM-J. A, A transverse view of spinal cord showing the extent of lesion (black shading) reconstructed from a series of horizontally cut spinal cord sections. B, Top, Schematic drawing represents an overview of an OM brain. The array location is indicated by a box. Middle, Photomicrograph from a myelin-stained section cut parallel to pia surface through somatosensory areas 3b and 1 showing the array location. Bottom, Schematic drawing showing a reconstructed somatotopic map from array. C, Heat maps of the peak firing rate responses across the array follow conventions of Figures 10–12 (color scale 5–85 spikes/s). Schematic drawings of OM hands indicate the sites for tactile stimulation (red dots with arrows) on individual digits. Stripes on hands indicate partial deafferentation. Peak firing rate responses were somewhat weak and restricted, but digit activations were represented in expected somatotopic order within territories determined from RF mapping. Dashed lines indicate rostral and caudal borders of area 3b. Conventions follow Figures 6 and 7.
Figure 14.
Figure 14.
Responsiveness in partially deprived area 3b in Monkey OM-D. A, A transverse view of spinal cord showing the extent of lesion (black shading) reconstructed from a series of horizontally cut spinal cord sections. B, Top. Schematic drawing shows an overview of an OM brain. The array location is indicated by a box. Middle, Photomicrograph from a myelin-stained section cut parallel to pia surface through somatosensory areas 3b and 1 shows the array location. Bottom, Schematic drawing shows a reconstructed somatotopic map from the array. C, Heat maps of the peak firing rate responses across the array follow conventions of Figures 10–13 (color scale 5–85 spikes/s). Schematic drawings of OM hands indicate the sites for tactile stimulation (red dots with arrows) on individual digits. Stripes on hands refer to partial deafferentation. Peak firing rate responses in territories of D3 and D4 were strong and extensive. Digits were represented in expected somatotopic order, but high firing rates during D3 or D4 stimulation were recorded from neurons expected to be found in neighboring digit territories. Dashed lines indicate rostral and caudal borders of area 3b. Conventions follow Figures 6 and 7.
Figure 15.
Figure 15.
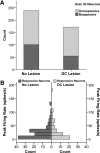
Counts of responsive neurons and peak firing rate distributions from well-isolated single neurons in area 3b. A, B, Data include 1 peak firing rate value per neuron per monkey (the maximum peak firing rate was selected from the recordings during tactile stimulation on different hand locations). A, Counts divided into neurons that were unresponsive (light gray) or responsive (dark gray) to mechanical stimulation on tested hand locations in 5 normal monkeys with no lesion and 5 monkeys after DC lesion. Statistical differences were not detected between the distributions of responsive neurons in normal and lesion monkeys (101 of 239 and 55 of 172, respectively). B, Frequency distributions of peak firing responses to tactile stimulation on the hand were similar for neurons sampled from electrode array recordings in monkeys after DC lesions (light gray, 55 neurons) and in normal control monkeys with no lesion (dark gray, 101 neurons), with an overall median of 18.2 spikes/s.
Figure 16.
Figure 16.
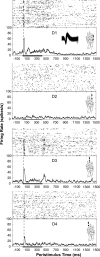
Series of peristimulus time histograms and rasters across stimulation locations show responses for unit 82b in Monkey SM-G, representing activation beyond one digit location with discontinuous activation patterns. Trace of waveforms from neuron 82b is inset; trace window duration is 1.6 ms. Stimulation was presented in blocks of 150 trials on digit locations indicated on drawings of monkey hands (D1–D4). Vertical dashed lines indicate the latency of the peak response. The duration for each stimulus was 400 ms, indicated by the horizontal line.
Figure 17.
Figure 17.
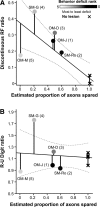
Relationships between lesion extent and cortical reactivation properties. A, Discontinuous RF ratio (y-axis) is the ratio representing discontinuous response fields from the total multisite response fields. This measure is correlated with the estimated proportion of axons spared (x-axis), as shown in a scatter plot for each monkey case. Normal cases are represented by a black X. Normal monkeys (n = 5) are plotted in the x-axis dimension as 100% spared, but some points overlap. The scale and conventions apply to both panels. Dashed lines indicate 95% confidence intervals based on the predicted mean linear regression fit line, shown as a solid line (y = 0.37 − 0.34x, R2 = 0.666). B, Relationship between the R-U digit ratio (y-axis) versus estimated proportion of axons spared (x-axis) shown in a scatter plot for each monkey case. Dashed lines indicate 95% confidence intervals based on the predicted mean linear regression fit line, shown as a solid line (y = 1.19 − 0.08x, R2 = 0.014). Most normal and lesion cases had digit territory ratios near 1, which is expected if no territories expand. Monkey SM-G (C6 lesion) showed evidence of radial digit territory expansion.

Similar articles

Cited by

References

    1. Abraira VE, Ginty DD. The sensory neurons of touch. Neuron. 2013;79:618–639. doi: 10.1016/j.neuron.2013.07.051. - DOI - PMC - PubMed
    1. Aguilar J, Humanes-Valera D, Alonso-Calviño E, Yague JG, Moxon KA, Oliviero A, Foffani G. Spinal cord injury immediately changes the state of the brain. J Neurosci. 2010;30:7528–7537. doi: 10.1523/JNEUROSCI.0379-10.2010. - DOI - PMC - PubMed
    1. Bradbury EJ, Carter LM. Manipulating the glial scar: chondroitinase ABC as a therapy for spinal cord injury. Brain Res Bull. 2011;84:306–316. doi: 10.1016/j.brainresbull.2010.06.015. - DOI - PubMed
    1. Bruce K, Grofova I. Notes on a light and electron microscopic double-labeling method combining anterograde tracing with Phaseolus vulgaris leucoagglutinin and retrograde tracing with cholera toxin subunit B. J Neurosci Methods. 1992;45:23–33. doi: 10.1016/0165-0270(92)90040-K. - DOI - PubMed
    1. Calford MB. Dynamic representational plasticity in sensory cortex. Neuroscience. 2002;111:709–738. doi: 10.1016/S0306-4522(02)00022-2. - DOI - PubMed

Publication types

LinkOut - more resources

  NODES
Note 1
Project 1
twitter 2