. 2014 May 1;509(7498):105-9.
doi: 10.1038/nature13148. Epub 2014 Mar 30.

Quantitative proteomics identifies NCOA4 as the cargo receptor mediating ferritinophagy

Affiliations

Quantitative proteomics identifies NCOA4 as the cargo receptor mediating ferritinophagy

Joseph D Mancias et al. Nature. .

Abstract

Autophagy, the process by which proteins and organelles are sequestered in double-membrane structures called autophagosomes and delivered to lysosomes for degradation, is critical in diseases such as cancer and neurodegeneration. Much of our understanding of this process has emerged from analysis of bulk cytoplasmic autophagy, but our understanding of how specific cargo, including organelles, proteins or intracellular pathogens, are _targeted for selective autophagy is limited. Here we use quantitative proteomics to identify a cohort of novel and known autophagosome-enriched proteins in human cells, including cargo receptors. Like known cargo receptors, nuclear receptor coactivator 4 (NCOA4) was highly enriched in autophagosomes, and associated with ATG8 proteins that recruit cargo-receptor complexes into autophagosomes. Unbiased identification of NCOA4-associated proteins revealed ferritin heavy and light chains, components of an iron-filled cage structure that protects cells from reactive iron species but is degraded via autophagy to release iron through an unknown mechanism. We found that delivery of ferritin to lysosomes required NCOA4, and an inability of NCOA4-deficient cells to degrade ferritin led to decreased bioavailable intracellular iron. This work identifies NCOA4 as a selective cargo receptor for autophagic turnover of ferritin (ferritinophagy), which is critical for iron homeostasis, and provides a resource for further dissection of autophagosomal cargo-receptor connectivity.


Figures

Extended Data Figure 1
Extended Data Figure 1. Autophagosome enrichment protocol validation
a, Overlap of proteins identified in three prior autophagosome proteomics studies- as evaluated by area-proportional Venn diagram. Proteins overlapping between datasets are noted. b, PANC1 cells stably expressing GFP-MAP1LC3B have a high level of basal autophagy (left panel). 1h Wortmannin (200 nM) treatment blocks autophagosome formation (middle panel) and 4h chloroquine treatment (25 μM) causes accumulation of autophagosomes (right panel). c, Lysed 8988T cells mixed with Nycodenz and placed at the bottom of a discontinuous density gradient with Nycodenz layers at the indicated concentrations (left). After 3h centrifugation at indicated speed, 4 bands appear at the indicated interfaces with enrichment of the indicated organelles in each interface (right). d, 8988T cells treated with either Wortmannin (1h, 200 nM) or Chloroquine (4h, 25 μM) subjected to gradient centrifugation. A decreased amount of material is recovered from the A1 (autophagosome) interface due to the effect of Wortmannin on autophagosome formation. e, Fluorescence microscopy of gradient load (LD) and autophagosome fraction (A1) from 8988T cells stably expressing GFP-MAP1LC3B after either chloroquine or wortmannin treatment. f, Fluorescence microscopy of indicated fractions from density gradient of 8988T cells stably expressing GFP-MAP1LC3B treated with chloroquine (A1 fraction image is also presented in panel e and gradient picture is also presented in panel c). g, PANC1 autophagosome fractions analyzed by immunoblotting using antibodies to LAMP2, VDAC1, and LC3B. LD is gradient load, A1 is autophagosome fraction from 15-20% nycodenz interface, A2 is the autophagolysosome fraction from the 20-24% nycodenz interface, L is the lysosome fraction from the 24-26% nycodenz interface, M is the mitochondrial fraction from the 26%-50% nycodenz interface. h, 8988T autophagosome fractions analyzed as in g. i, 8988T autophagosomes (A1 fraction) were incubated at 37°C for 1 hour -/+ Triton X-100 and centrifuged at high speed. The resulting pellet was resuspended in equal volume to supernatant and assayed by immunoblotting with antibodies to p62 and LC3B. j, Pearson correlation plot for overlapping candidates from MCF7 experiments (102 proteins, comparing Ex. 1 vs. Ex. 2). k, Electron micrographs of 8988T gradient load (LD, left panel) and 8988T autophagosome fraction (A1, right panel) at 6800× magnification, scale bar 500 nm. l, 8988T gradient load (LD, left panel) and 8988T autophagosome fraction (A1, right panel) at 18500× magnification, scale bar 500 nm. m, 8988T autophagosome fraction (A1) at 23000× magnification, scale bar 100 nm. Arrowhead: double-membrane autophagosome, Arrow: fused autophagolysosome.
Extended Data Figure 2
Extended Data Figure 2. Autophagosome proteomics candidate list and validation in 8988T cells
a, Autophagosome proteomics class 1A candidate list b, Overlap between Class 1 candidates (MCF7 and PANC1) and candidates from 4 hr CQ SILAC 8988T gradient autophagosome purification experiment. c, Data from 8988T SILAC gradient autophagosome for Class 1A candidates (and FTH1, see also Table S6). d, Heat map of Class 1A candidates (and FTH1) comparing PANC1 4h CQ and 8988T 4h CQ experiments.
Extended Data Figure 3
Extended Data Figure 3. Candidates from autophagosome proteomics colocalize in autophagosomes
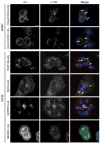
Representative confocal images of 8988T and U2OS cells expressing HA-tagged candidates after CQ treatment. Colocalization of HA-tagged candidates (green) with endogenous LC3B (red). Representative colocalization marked by white arrows. Scale bar, 10 μm. MGRN1 is included as an example of one of the candidates that did not show colocalization.
Extended Data Figure 4
Extended Data Figure 4. Immunopurification-based autophagosome proteomics
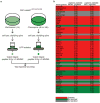
a, Schematic for GFP-immunoisolation of GFP-LC3B labeled autophagosomes from 8988T cells. b, Data from GFP-immunoisolation for Class 1A candidates (see also Table S7).
Extended Data Figure 5
Extended Data Figure 5. Comparative analysis of Class 1 and 2 proteins with Dengjel et al. autophagosome proteomics
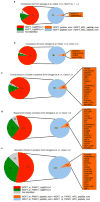
a, Analysis and comparison of Dengjel et al data and candidate list with data derived from MCF7 autophagosome proteomics experiments as detailed in methods section (see also Table S8). Orange shading of gene symbols denotes proteins identified as MCF7 candidates. The key for panel a only is below the pie charts. b-e, Analysis and comparison of Dengjel et al data and candidate list with data derived from both MCF7 and PANC1 autophagosome proteomics experiments (Class 1 and 2 proteins) as detailed in methods section. The key for panels b-e is below panel e. Orange shading of gene symbols denotes proteins identified as Class 1 or 2 candidates. (see also Table S8).
Extended Data Figure 6
Extended Data Figure 6. NCOA4 colocalizes with LC3B and GABARAPL2 in autophagosomes
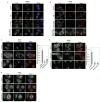
a, GFP-NCOA4 (green) co-localizes with mCherry-LC3B (red) in CQ-treated cells. Scale bar, 20 μm. b, GFP-NCOA4 (green) co-localizes with mCherry-GABARAPL2 (red) in CQ-treated cells. Scale bar, 20 μm. c, GFP-NCOA4 (green) co-localizes with endogenous GABARAPL2 (red) in CQ-treated cells. Scale bar, 20 μm. d, GFP-NCOA4 (green) does not colocalize with endogenous Mannose 6-Phosphate Receptor (M6PR) (red) in CQ-treated cells. Scale bar, 20 μm. e, HERC2 does not co-localize in autophagosomes. Immunostaining of U2OS cells subjected to CQ treatment, endogenous LC3 (green) and endogenous HERC2 (red), scale bar, 20 μm.
Extended Data Figure 7
Extended Data Figure 7. Ferritin undergoes primarily lysosomal mediated degradation
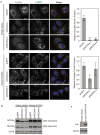
a, 8988T cells were cultured with FAC for 24 hours, washed, followed by chelation with 3 chelators (DFO, BPS, DFP) -/+ lysosomal protease inhibitors (E-64d and PepstatinA) or proteasomal inhibitor, Bortezomib (lane 5) for 8 hours. Lysates were immunoblotted using antibodies to ACTB and FTH1. b, U2OS cells were cultured with FAC for 24 hours, washed, followed by chelation with 2 chelators (DFO, DFX) -/+ lysosomal protease inhibitors (E-64d and PepstatinA) and analyzed as in panel A. c, 8988T cells transfected with luciferase control siRNA or validated siRNA to ATG5 were cultured with FAC, washed, and subjected to DFO chelation for 9 hours. Lysates were immunoblotted using antibodies to FTH1, ATG5, and ACTB. d, RNAi-mediated knockdown of NCOA4 in 8988T cells. 8988T cells stably expressing a control shRNA (shGFP) and two independent shRNAs to NCOA4 (shNCOA4-1 and shNCOA4-2) were lysed and analyzed by immunoblotting with two different antibodies to NCOA4 and ACTB as a loading control. Middle panel shows immunoblot probed with NCOA4 antibody from Bethyl Laboratories (#A302-272A). A non-specific band migrates just below the NCOA4 specific band. Top panel shows immunoblot probed with NCOA4 antibody from Sigma (SAB1404569). e, U2OS cells stably expressing shGFP, shNCOA4-1, or shNCOA4-2 were analyzed by immunoblotting as in panel d. f, NCOA4 depletion rescues ferritin degradation upon 9 hours iron chelation in U2OS. Relative FTH1 levels (n=3) for each chelator are quantified. Bars and error bars represent mean values and s.d., respectively: ** (p<0.01) and * (p<0.02) comparing FTH1 levels between different cell lines to shGFP control (one-sided t-test). g, U2OS cells stably expressing shGFP, shNCOA4-1, or shNCOA4-2 were cultured with FAC for 24 hours, washed, and subjected to DFO chelation -/+ lysosomal protease inhibitors. Lysates were immunoblotted using antibodies to NCOA4, FTH1, and ACTB.
Extended Data Figure 8
Extended Data Figure 8. NCOA4 mediates autophagic delivery of ferritin to lysosomes
a, 8988T cells were cultured in the presence or absence of FAC for 24 hours, washed, and subjected to DFO chelation -/+ lysosomal protease inhibitors (E-64d and PepstatinA). Cells were fixed and immunostained using antibodies to ferritin (red) and LAMP2 (green). Higher magnification views of the boxed areas are shown in the insets. Scale bar, 10 μm. b, U2OS cells treated and analyzed as in panel a. c, Immunostaining of U2OS cells expressing a control shRNA (shGFP) and two independent shRNAs to NCOA4 (shNCOA4-1 and shNCOA4-2) subjected to DFO chelation in the presence of lysosomal protease inhibitors for 9 hours. Scale bar, 10 μm. Punctate ferritin fraction was quantified from >75 cells per cell line from 2 independent experiments (number of U2OS cells quantitated is as follows: shGFP: 133 cells, shNCOA4-1: 103 cells, shNCOA4-2: 79 cells). Bars and error bars represent mean values and s.d., respectively: ***denotes p<0.001 using a one-sided t-test. d, IMR90 cells as in panel c were treated and immunostained as in panel c. Scale bar, 50 μm. Punctate ferritin fraction was quantified from >25 cells per cell line in two independent experiments and from more than 10 microscopy fields (number of IMR90 cells quantified is as follows: shGFP: 29 cells, shNCOA4-1: 26 cells, shNCOA4-2: 31 cells). Bars and error bars represent mean values and s.d., respectively: ***denotes p<0.001 using a one-sided t-test. e, HPDE cells as in panel c were treated and immunostained as in panel c. Scale bar, 10 μm. Quantitation was not possible due to the high background signal in shGFP control cells.
Extended Data Figure 9
Extended Data Figure 9. A non-degradable murine NCOA4 rescues RNAi-mediated NCOA4 knockdown
a, 8988T cells stably expressing either a control MSCV empty vector or the murine homolog of NCOA4 (selected with blasticidin) as well as stably expressing shRNAs (shGFP, shNCOA4-1, shNCOA4-2, selected with puromycin) were cultured in the presence or absence of FAC for 24 hours, washed, and subjected to DFO chelation in the presence of lysosomal protease inhibitors (E-64d and PepstatinA). Cells were fixed and immunostained using antibodies to ferritin (red) and LAMP2 (green). Scale bar, 10 μm. Punctate ferritin fraction was quantified from ≥100 cells per cell line (number of 8988T cells quantified is as follows: 8988T-control MSCV-shGFP: 100 cells, 8988T-control-MSCV-shNCOA4-1: 125 cells, 8988T-control-MSCV-shNCOA4-2: 132 cells, 8988T-mouse-NCOA4-shGFP: 151 cells, 8988T-mouse-NCOA4-shNCOA4-1: 153 cells, 8988T-mouse-NCOA4-shNCOA4-2: 172 cells). Bars and error bars represent mean values and s.d., respectively: ***denotes p<0.001 using a one-sided t-test. b, RNAi-mediated knockdown of NCOA4 in 8988T cells. 8988T cells stably expressing either a control MSCV empty vector or the murine homolog of NCOA4 (selected with blasticidin) as well as stably expressing a control shRNA (shGFP) and two independent shRNAs to NCOA4 (shNCOA4-1 and shNCOA4-2) were lysed and analyzed by immunoblotting with an antibody to NCOA4 and ACTB as a loading control. Light and dark exposures are shown. A non-specific band migrates just below the NCOA4 specific band. c, Expression of murine HA-NCOA4 protein in 8988Ts. Cell lysates were probed with HA antibody.
Extended Data Figure 10
Extended Data Figure 10. NCOA4 mediates autophagic delivery of ferritin to lysosomes to control iron homeostasis
a, Immunostaining of 8988T cells transfected with luciferase control siRNA or two independent siRNAs to NCOA4 and subjected to DFO chelation in the presence of lysosomal protease inhibitors for 9 hours. Scale bar, 20 μm. b, Immunostaining of 8988T cells transfected with luciferase control siRNA or two independent siRNAs to HERC2 and subjected to DFO chelation in the presence of lysosomal protease inhibitors for 9 hours. Scale bar, 20 μm. c, 8988T cells were transfected with luciferase control siRNA or two independent siRNAs to HERC2. Lysates were immunoblotted using antibodies to HERC2 and ACTB. d, siRNA-mediated knockdown of NCOA4 in U2OS, IMR90 and, 8988T cells leads to increase in IRP2, FTH1, and TFRC levels. Cells were transfected with luciferase control siRNA or two independent siRNAs to NCOA4. Lysates were immunoblotted using antibodies to NCOA4, IRP2, TFRC, FTH1, and ACTB. Light and dark exposures are shown for TFRC. e, NCOA4 expression levels are affected by iron levels and NCOA4 levels affect ferritin levels in response to iron load. 8988T cells stably expressing either a control MSCV empty vector or mouse NCOA4 were cultured in the presence of FAC for the indicated times. Cells were lysed and analyzed by immunoblotting with antibodies to NCOA4, FTH1 and ACTB as a loading control. A non-specific band migrates just below the NCOA4 specific band.
Figure 1
Figure 1. Quantitative proteomics for identification of autophagosome-associated proteins
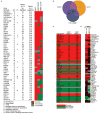
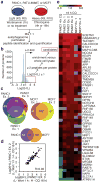
(a) Autophagosome enrichment workflow. (b) Log2(H:L) plot for autophagosome proteins from PANC1 cells (Ex. 3, Table S3) and scheme for identification of candidate autophagosome proteins. (c) Autophagosome candidate overlap from biologic replicate experiments for PANC1 and MCF7 cells, as well as overlap between PANC1 and MCF7 datasets. (d) Pearson correlation plot for overlapping candidates from PANC1 experiments (86 proteins, comparing Ex. 2 vs. Ex. 3). (e) Log2(H:L) heat map of Class 1A candidates from PANC1 and MCF7 cells.
Figure 2
Figure 2. NCOA4 associates with and co-localizes with ferritin
(a) GFP-NCOA4 (green) co-localizes with endogenous LC3 (red) in CQ-treated cells. Scale bar, 20 μm. (b) GST-pull-down assay of NCOA4-HA-FLAG from stable 293T cells using GST-ATG8 proteins. HA immunoblot for NCOA4-HA-FLAG. (c) Lysates from 8988T cells treated with CQ or BAF (8h) were immunoblotted for NCOA4, LC3B, and ACTB as a loading control. *, cross-reactive band (see Extended Data Fig. 7d-e). (d) 8988T autophagosome purification fractions were analyzed using antibodies to NCOA4 and LC3B. TAX1BP1, a newly identified autophagy receptor, was included as a positive control. LD is gradient load, A1 is autophagosome fraction, A2 is the autophagolysosome fraction, L is the lysosome fraction, M is the mitochondrial fraction. (e) NCOA4 interaction network from cells expressing NCOA4-HA-FLAG or FTH1-HA-FLAG (Table S9). Black lines (this study) depict directionality of interaction observed with line thickness weighted by WDN-score (293T dataset). Dotted lines, STRING database. Numbers in parentheses indicate log2(H:L) ratio of NCOA4, FTH1, and FTL from MCF7 Ex. 1 dataset (Table S4). (f,g) Extracts from 293T cells stably expressing the indicated proteins were immunoprecipitated with α-FLAG and immunoblotted with the indicated antibodies. α-ACTB, loading control. (h) Representative confocal images of GFP-NCOA4 (green) and ferritin (red) after no treatment or FAC treatment (24 h). Scale bar, 10 μm.
Figure 3
Figure 3. NCOA4 mediates autophagic delivery of ferritin to lysosomes to control iron homeostasis
(a) NCOA4 depletion rescues ferritin degradation upon 9 h iron chelation in 8988T. Relative FTH1 levels (n=3, biologic triplicate) for each chelator are quantified. Bars and error bars represent mean values and s.d., respectively: ** (p<0.01) and * (p<0.02) comparing FTH1 levels between different cell lines (one-sided t-test). (b) DFO chelation time course in U2OS cells, DFO added at time 0, two NCOA4 antibodies are used for immunoblotting (top panel Sigma antibody, 2nd panel Bethyl antibody). (c) GFP-NCOA4 (green) co-localizes with endogenous LC3 (red) and endogenous ferritin (blue) in U2OS cells subjected to DFO chelation in the presence of lysosomal protease inhibitors for 6 h. Scale bar, 20 μm. (d) Immunostaining of 8988T cells subjected to DFO chelation in the presence of lysosomal protease inhibitors for 9 h. Scale bar, 10 μm. Punctate ferritin fraction was quantified from >100 cells per cell line from 2 independent experiments (biologic duplicate). Bars and error bars represent mean values and s.d., respectively: ***denotes p<0.001 using a one-sided t-test. (e) Lysates from 8988T cells as in panel A were analyzed using indicated antibodies (lanes 1-3, untreated), with quantification based on at least 3 independent experiments (biologic triplicate). Bars and error bars represent mean values and s.d., respectively: * (p<0.05) using a one-sided t-test. (f) 8988T cells stably expressing shGFP or shNCOA4-1 were treated with H2O2 and cell viability was measured at 72 h. Bars and error bars represent mean values and s.d., respectively of technical triplicates: *** (p<0.001) using a two-sided t-test.

Comment in

Similar articles

Cited by

References

    1. Yang Z, Klionsky DJ. Eaten alive: a history of macroautophagy. Nature Cell Biology. 2010;12:814–822. doi: 10.1038/ncb0910-814. - DOI - PMC - PubMed
    1. Kroemer G, Marino G, Levine B. Autophagy and the integrated stress response. Molecular Cell. 2010;40:280–293. doi: 10.1016/j.molcel.2010.09.023. - DOI - PMC - PubMed
    1. Kirkin V, McEwan DG, Novak I, Dikic I. A role for ubiquitin in selective autophagy. Molecular Cell. 2009;34:259–269. doi: 10.1016/j.molcel.2009.04.026. - DOI - PubMed
    1. Pantopoulos K, Porwal SK, Tartakoff A, Devireddy L. Mechanisms of mammalian iron homeostasis. Biochemistry. 2012;51:5705–5724. doi: 10.1021/bi300752r. - DOI - PMC - PubMed
    1. Asano T, et al. Distinct mechanisms of ferritin delivery to lysosomes in iron-depleted and iron-replete cells. Molecular and Cellular Biology. 2011;31:2040–2052. doi: 10.1128/MCB.01437-10. - DOI - PMC - PubMed

Methods Reference

    1. Lopes CT, et al. Cytoscape Web: an interactive web-based network browser. Bioinformatics. 2010;26:2347–2348. doi: 10.1093/bioinformatics/btq430. - DOI - PMC - PubMed
    1. Schneider CA, Rasband WS, Eliceiri KW. NIH Image to ImageJ: 25 years of image analysis. Nature Methods. 2012;9:671–675. - PMC - PubMed

Publication types

MeSH terms

  NODES
Note 7
twitter 2