. 2014 May 7;82(3):603-17.
doi: 10.1016/j.neuron.2014.03.003. Epub 2014 Apr 17.

Stepwise recruitment of transcellular and paracellular pathways underlies blood-brain barrier breakdown in stroke

Affiliations

Stepwise recruitment of transcellular and paracellular pathways underlies blood-brain barrier breakdown in stroke

Daniel Knowland et al. Neuron. .

Abstract

Brain endothelial cells form a paracellular and transcellular barrier to many blood-borne solutes via tight junctions (TJs) and scarce endocytotic vesicles. The blood-brain barrier (BBB) plays a pivotal role in the healthy and diseased CNS. BBB damage after ischemic stroke contributes to increased mortality, yet the contributions of paracellular and transcellular mechanisms to this process in vivo are unknown. We have created a transgenic mouse strain whose endothelial TJs are labeled with eGFP and have imaged dynamic TJ changes and fluorescent tracer leakage across the BBB in vivo, using two-photon microscopy in the t-MCAO stroke model. Although barrier function is impaired as early as 6 hr after stroke, TJs display profound structural defects only after 2 days. Conversely, the number of endothelial caveolae and transcytosis rate increase as early as 6 hr after stroke. Therefore, stepwise impairment of transcellular followed by paracellular barrier mechanisms accounts for the BBB deficits in stroke.


Figures

Figure 1
Figure 1. Genetic labeling of endothelial tight junctions with eGFP
(A) Diagram of eGFP-Claudin5 fusion protein localization within endothelial cells (ECs) in transgenic mice. (B–D) Maximum intensity projection images showing 120 μm thick cortical volumes recorded with two-photon microscopy in an anesthetized Tg eGFP-Claudin5 transgenic mouse. eGFP labels TJs between ECs in venules (B, small yellow rectangle; C, yellow arrows) and capillaries (B, large yellow rectangle; D; yellow arrows). (E, F) Visualization of TJs in retinal blood vessels with eGFP. Griffonia (Bandeiraea) simplicifolia Lectin I (BSL) labels blood vessels (F). (G, H) Western blots with brain and liver lysates from Tg eGFP-Claudin5 and wild-type mice for Claudin5 (G) and β-actin (H; 42 kDa). The eGFP-Claudin5 fusion is approximately 56 kDa and wild-type Claudin5 is 24 kDa. (I) Quantitation of relative amounts of Claudin5 protein in transgenic and wild-type mice. Levels of Claudin5 protein in wild-type mice were used as a standard (100 percent, dotted line, blue bars). Levels of Claudin5 protein in transgenic mice are presented as a percentage of protein levels in wild-type mice, each being normalized to its respective β-actin control. Transgenic animals have almost twice the amount of Claudin5 protein, from both the endogenous locus (blue bars) and the transgene (green bars). (J–M) The fusion protein is localized to TJs in brain ECs, together with Occludin and ZO-1. See Figure S1 for expression of the fusion protein in other organs. Scale bars = 50 μm.
Figure 2
Figure 2. Integrity of cortical blood vessel TJs is impaired at late but not early time points following stroke in live Tg eGFP-Claudin5 mice
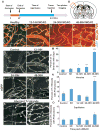
(A, B) Diagram of the experimental procedure and cortical region where in vivo two-photon imaging was performed in Tg eGFP-Claudin5 mice. (C–F) Maximum intensity projections of 120 μm thick cortical volumes from healthy mouse brain (C) and 12–14 h (D), 24–30 h (E) and 48–58 h (F) after t-MCAO obtained with two-photon imaging through a cranial window. The imaging areas were located within the stroke core region (D–F). eGFP labels TJs. Biocytin-TMR tracer leakage from blood vessels into the CNS parenchyma was visualized 30 min after tail vein injection in E, F (red background). (G–L) Maximum intensity projections of 120 μm thick cortical volumes showing TJs in venules and capillaries of healthy control (G) and diseased mice 12–14 h (H), 24–30 h (I), and 48–58 h (J–L) following t-MCAO. Notice the presence of gaps (J, K; white arrows), protrusions (J, K; arrowheads) and aberrant zigzag TJ morphology (L, yellow arrow) at 48–58 h. Yellow dots indicate blood vessel boundaries outlined by the presence of the tracer (data not shown for simplicity). (M–O) Bar graphs showing the percent of TJ strands with gaps (M) and protrusions in venules (N) and capillaries (O) during stroke progression. The fraction of TJ strands with gaps or protrusions in venules, but not capillaries, is significantly different 48–58 h post-t-MCAO compared to the control. Data were collected from 2–8 independent fields of view (377 μm × 377 μm) that contained between 61–183 TJ strands in either venules or capillaries from the imaging area (n = 3–5 transgenic animals per time point). Data are represented as mean ± s.e.m, * p<0.05; *** p<0.001, ****p<0.0001, mixed effect ANOVA. See Figure S2 for a quantitative comparison of biocytin-TMR and IgG leakage during stroke progression in wild-type vs. Tg eGFP-Claudin5 mice and Movies S1–S2. Scale bar = 50 μm (C–J), 25 μm (K, L).
Figure 3
Figure 3. Continual two-photon time-lapse imaging of cortical endothelial TJs in healthy and diseased Tg eGFP-Claudin5 mice reveals that protrusions but not gaps are highly dynamic 48–58 h post t-MCAO
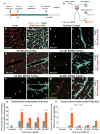
(A) Diagram of the experimental procedure for transcranial two-photon time-lapse imaging of Tg eGFP-Claudin5 mice. Four imaging sessions were conducted in both control and stroke animals. Each session lasted ~2 h and involved repeated optical recordings (every 15–25 min) from distinct cortical volumes. Stroke animals were imaged once before and three times after t-MCAO (~6 h or 12 h, then ~24 h and 48 h). Controls were imaged at corresponding time points. Imaging began ~24 h after thinned skull preparation (TSP). (B–E) Sample time-lapse images of eGFP+ TJs in cortical capillaries from control (B, C) or stroke animals (D, E). Images in B and D are from different days/imaging sessions, images in C and E from a selected day/imaging session (yellow boxed region in B and D). Stroke images (D, E) are from the stroke core region, verified post hoc 48–60 h post t-MCAO by tracer leakage into the parenchyma (data not shown). Cortical capillaries show very few protrusions in both healthy and stroke core tissue. Protrusions are particularly dynamic during the 47–50 h period after t-MCAO. (F–I) Time-lapse imaging example of eGFP+ TJs in cortical venules from control (F, G) or stroke animals (H, I; stroke core region). Venule protrusions are highly dynamic at several time points after t-MCAO and within the highlighted two-hour time-lapse period. Venules also have more protrusions than capillaries. Static protrusions present in all images are labeled in yellow, dynamic protrusions are labeled in red. (J, K) Time-lapse images of a venule before (J) and after (K) stroke illustrating gap formation (green arrows with letter G). See also Movies S3–S8 and Figure S3 for time-lapse images from the penumbra region. Scale bars = 10 μm (B–K).
Figure 4
Figure 4. Ultrastructural changes in endothelial TJs appear at late but not early time points following t-MCAO in Tg eGFP-Claudin5 mice
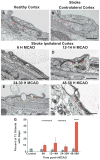
(A–F) Transmission electron microscopy (TEM) of TJs in ECs from healthy (A), contralateral (24 h post-t-MCAO; B) and ipsilateral stroke cortex at 6 h (C), 12–14 h (D), 24–30 h (E) and 48–58 h (F) post-t-MCAO. Note structurally abnormal TJs that contain large gaps (yellow arrows) within normal regions (red arrows) in particular 24–30 h and 48–58 h post-t-MCAO. (G) Bar graphs showing the fraction of TJ strands with gaps during stroke progression after t-MCAO from TEM analysis. The proportion of TJ strands with gaps is significantly different 48–58 h post-t-MCAO as compared to other groups. Data were collected from 65–70 independent fields of view (2.6 μm × 1.7 μm) that contained between 1–3 TJ strands in either venules or capillaries (n = 2–5 transgenic animals per time point). Data are represented as mean ± s.e.m, ****p<0.0001, one-way ANOVA. Scale bars = 400 nm. See Figure S4 for analysis of TJ and basement membrane protein expression during stroke in Tg eGFP-Claudin5 mice.
Figure 5
Figure 5. Early increase in endothelial caveolae within the cortical stroke region from Tg eGFP-Claudin5 mice following t-MCAO
(A–F) TEM of cortical ECs in healthy (A), contralateral (24 h post-t-MCAO; B) and ipsilateral stroke cortex at 6 h (C), 12–14 h (D), 24–30 h (E) and 48–58 h (F) post-t-MCAO. The vesicle number in ECs (red arrows) is increased as early as 6 h post-t-MCAO and remains above the control baseline up to 58 h post-t-MCAO. (G–L) Immuno-EM for Caveolin-1 in healthy (G), contralateral (H) and ipsilateral stroke cortex 6 h (I), 12–14 h (J), 24–30 h (K) and 48–58 h (L) post t-MCAO. The number of Cav-1+ vesicles (red arrows) is significantly increased in the stroke cortex at all time points. (M) Bar graph of the number of Cav1+ caveolae per area from immuno-EM images during stroke progression. The number of caveolae in each section is significantly higher in the ipsilateral (stroke; orange bars) versus contralateral (blue bars) cortex. (N) Bar graph of the basal distribution of Cav1+ caveolae in endothelial cells within the imaged area during stroke progression. Caveolae are found more frequently at the basal side of the endothelium in the ipsilateral (orange bars) versus contralateral (blue bars) cortex. Data were accumulated from 20–95 independent fields of view (2.6 μm × 1.7 μm) that contained between 1–4 ECs from venules or capillaries either within the cortical stroke core or contralateral region (n = 2–5 transgenic animals per time point). Data are represented as mean ± s.e.m, *p < 0.05, ***p < 0.001, ****p < 0.0001, one-way ANOVA. Scale bars = 400 nm.
Figure 6
Figure 6. Increased endocytosis and transcytosis rates in brain endothelium occur as early as 6 h post-t-MCAO
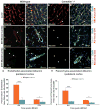
(A, B) Diagrams of the experimental procedure (A) and labeling of caveolae and other transcytosis vesicles with albumin-Alexa594 (alb-Alexa594; B). (C–N) Uptake of alb-Alexa594 in liver (C, D), healthy cortex (E, F) and ipsilateral stroke cortex from 6–48 h post-t-MCAO (G–N). Note the increase in alb-Alexa594 uptake within CNS endothelium labeled with Glut-1 as early as 6 h post-t-MCAO. Liver ECs are marked with BSL (green; D) and brain ECs with Glut-1 (F, H, J, L, N) in merged panels. Note the increase in alb-Alexa594 uptake within CNS endothelium as early as 6 h post-t-MCAO. (O–P) Bar graphs showing the percentage of Glut-1+ endothelial (O) or brain parenchyma (P) area filled with alb-Alexa594 in ipsilateral (orange) and contralateral (blue) cortex. The fraction of endothelial- and parenchyma-filled area with alb-Alexa594 is significantly higher at 6 h and 48 hours post-t-MCAO compared to healthy cortex. Data were collected from 4–9 independent fields of view that contained cortical venules or capillaries (n = 3–5 animals per time point). Data are represented as mean ± s.e.m, *p<0.05; ****p<0.0001, mixed effect ANOVA. Scale bars = 50 μm. See Figure S5 for analysis of percent of BSL+ endothelial or parenchyma area filled with alb-Alexa594 in ipsilateral and contralateral cortex.
Figure 7
Figure 7. Reduced endothelial endocytosis and transcytosis in Caveolin1-deficient mice in response to stroke
(A–F′) Uptake of alb-Alexa594 in liver (A–B′) and ipsilateral stroke cortex (C–F′) 6 h and 27 h post-t-MCAO in wild-type or Cav1−/− mice. Note the decrease in alb-Alexa594 uptake by ECs in liver or ipsilateral cortex for mutant versus wild-type mice. Liver ECs are labeled with BSL-FITC (green; A–B′) and brain ECs with Glut1 (green; C–F′) in merged panels. (G–H) Bar graphs showing the fraction of Glut1+ endothelial (G) or parenchymal (H) area filled with alb-Alexa594 in the ipsilateral cortex of wild-type (orange) or Cav1−/− mice (blue), 6 h and 27 h post t-MCAO. The percentage of endothelial and parenchymal area filled with alb-Alexa594 is significantly reduced 6 h and 27 hours post-t-MCAO in Cav-1−/− mice compared to controls. Data were collected from 4–9 independent fields of view that contain cortical venules or capillaries from wild-type (n = 3) or Cav1−/− (n = 3) mice per time point. Data are represented as mean ± s.e.m, *p<0.05; ****p<0.0001, paired t-test. Scale bars = 50 μm (A–F′). See Figure S6 for quantitative analysis of the fraction of BSL+ endothelial or parenchymal area filled with alb-Alexa594 in the ipsilateral cortex from wild-type or Cav1−/− mice, 6 h and 27 h post t-MCAO, and characterization of Alb+ Cav1 vesicles in primary brain endothelial cells.
Figure 8
Figure 8. Cav1-deficient mice exhibit an increase in paracellular endothelial permeability similar to wild-type mice following t-MCAO
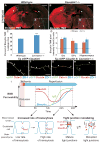
(A –B) Brain sections from wild-type (A) or Cav1−/− (B) mice showing Biocytin-TMR leakage 27 h post-t-MCAO. The area of biocytin-TMR leakage and the outline of the brain section are marked with dashed white lines. Note the extensive leakage of tracer into the cortex and putamen. The choroid plexus (A, B; arrows) is intensely labeled due to lack of the barrier. (A′, B′) Higher magnification images for the yellow squares shown in (A, B). (C) Bar graph showing the fraction of biocytin-TMR leakage area in wild-type or Cav1−/− mice. The increased fraction of biocytin-TMR areas in mutant mice is due to tracer in the thalamus. (D) Bar graphs of the biocytin-TMR average pixel intensity ratio between ipsilateral and contralateral areas for cortex, putamen and hippocampus in wild-type (orange bars) or Cav1−/− mice (blue bars). There is no significant difference in biocytin-TMR leakage intensity for matched anatomical regions. Data are represented as mean ± s.e.m, ****p<0.0001, paired t-test. (E–H) Expression of eGFP-Claudin5, Claudin5, Occludin and ZO-1 in Tg eGFP-Claudin5 (E, F) and Tg eGFP-Claudin5 Cav1−/− mice (G, H). TJ proteins are correctly localized in CNS ECs of both strains. (I) Schematic representation of increases in biocytin-TMR (blue), IgG (green) and alb-Alexa594 (red) over time following t-MCAO. There is a non-linear, gradual increase in biocytin-TMR and IgG permeability during stroke progression that becomes significant 24–48 h after t-MCAO, and correlates with the abundance of structural defects in TJs (i.e. junction remodeling). In contrast, alb-Alexa594 uptake increases as early as 6 h post-t-MCAO, suggesting that endocytosis and transcytosis are increased in early phases of ischemic stroke. Upregulation of both Cav1-dependent and -independent endothelial transcytosis, followed by TJ disassembly, contribute to enhanced BBB permeability after t-MCAO. Scale bars = 400 μm (A, B) and 50 μm (E–H). See Figure S7 for analysis of IgG leakage after stroke, the morphology of TJs with TEM and TJ protein levels in wild-type versus Cav1−/− brains.

Similar articles

Cited by

References

    1. Abbott N, Patabendige A, Dolman D, Yusof S, Begley D. Structure and function of the blood-brain barrier. Neurobiology of Disease. 2010;37:13–25. - PubMed
    1. Anderson JM, Van Itallie CM. Physiology and function of the tight junction. Cold Spring Harbor perspectives in biology. 2009;1:a002584. - PMC - PubMed
    1. Arac A, Brownell SE, Rothbard JB, Chen C, Ko RM, Pereira MP, Albers GW, Steinman L, Steinberg GK. Systemic augmentation of alphaB-crystallin provides therapeutic benefit twelve hours post-stroke onset via immune modulation. Proceedings of the National Academy of Sciences of the United States of America. 2011;108:13287–13292. - PMC - PubMed
    1. Arai K, Jin G, Navaratna D, Lo EH. Brain angiogenesis in developmental and pathological processes: neurovascular injury and angiogenic recovery after stroke. Febs J. 2009;276:4644–4652. - PMC - PubMed
    1. Arai K, Lok J, Guo S, Hayakawa K, Xing C, Lo EH. Cellular mechanisms of neurovascular damage and repair after stroke. J Child Neurol. 2011;26:1193–1198. - PMC - PubMed

Publication types

  NODES
Note 5
Project 3
twitter 2