. 2014 Jun;124(6):2378-95.
doi: 10.1172/JCI70313. Epub 2014 Apr 24.

Epigenetic reprogramming induces the expansion of cord blood stem cells

Epigenetic reprogramming induces the expansion of cord blood stem cells

Pratima Chaurasia et al. J Clin Invest. 2014 Jun.

Abstract

Cord blood (CB) cells that express CD34 have extensive hematopoietic capacity and rapidly divide ex vivo in the presence of cytokine combinations; however, many of these CB CD34+ cells lose their marrow-repopulating potential. To overcome this decline in function, we treated dividing CB CD34+ cells ex vivo with several histone deacetylase inhibitors (HDACIs). Treatment of CB CD34+ cells with the most active HDACI, valproic acid (VPA), following an initial 16-hour cytokine priming, increased the number of multipotent cells (CD34+CD90+) generated; however, the degree of expansion was substantially greater in the presence of both VPA and cytokines for a full 7 days. Treated CD34+ cells were characterized based on the upregulation of pluripotency genes, increased aldehyde dehydrogenase activity, and enhanced expression of CD90, c-Kit (CD117), integrin α6 (CD49f), and CXCR4 (CD184). Furthermore, siRNA-mediated inhibition of pluripotency gene expression reduced the generation of CD34+CD90+ cells by 89%. Compared with CB CD34+ cells, VPA-treated CD34+ cells produced a greater number of SCID-repopulating cells and established multilineage hematopoiesis in primary and secondary immune-deficient recipient mice. These data indicate that dividing CB CD34+ cells can be epigenetically reprogrammed by treatment with VPA so as to generate greater numbers of functional CB stem cells for use as transplantation grafts.


Figures
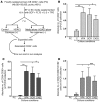
Figure 1
Figure 1. Effect of HDACIs on the ex vivo expansion of CB CD34+, CD34+CD90+, and CD34+CD90+CD184+ cells.
(A) Schematic representation of the ex vivo expansion strategy of primary CB CD34+ cells (PCs). Freshly isolated PCs were primed for 16 hours with cytokines either in SF or SC media. Cells were then further treated for 7 days under the mentioned culture conditions with or without additional cytokines and in the presence or absence of HDACIs. The expanded and reisolated CD34+ cells were used for further analyses. Individual PCs were treated in the absence (control) or presence of VPA, SCR, or CAY10433 (C433) for 7 days in SF media with cytokines. VPA led to the generation of a significantly greater absolute number of CD34+ cells (*P < 0.05; **P < 0.005) (B), CD34+CD90+ cells (*P < 0.05; **P < 0.005) (C), and CD34+CD90+CD184+ cells (***P = 0.0005) (D) per CB collection (mean ± SEM; ANOVA, P ≤ 0.0007 [B and C] and ANOVA, P < 0.0001 [D]) than did other HDACIs (n = 6–7). C, control.
Figure 2
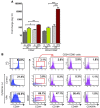
Figure 2. Effect of VPA on the ex vivo expansion of CB CD34+ and CD34+CD90+ cells.
(A) The generation of CB CD34+ and CD34+CD90+ cells in the presence of cytokines occurred to a greater degree in SF than in SC cultures. A significant difference in the fold increase of CD34+ and CD34+CD90+ cells was observed in VPA-containing SF cultures as compared with SC cultures. *P < 0.05; **P < 0.005; ***P < 0.0005 (mean ± SEM; ANOVA, P < 0.0001; n = 6–7). (B) Phenotypic analysis of PC and CD34+ cells treated in SF media under control conditions or in the presence of VPA. Each cell population was analyzed for the expression of CD34, CD90, CXCR4 (CD184), CD49f, and CD45RA. The coexpression of CD184, CD49f, and CD45RA by CD34+CD90+ cells (red box) is depicted (n = 4).
Figure 3
Figure 3. Effect of VPA on CD34+ cell migration and homing.
(A) SDF1 (100 ng/ml) induced migration of reisolated CD34+ cells generated in the absence (control) or presence of VPA (7 days). A significantly greater number of VPA-treated CD34+ cells migrated toward SDF1 after 16 and 48 hours (mean ± SEM, *P < 0.05, one-tailed t test; n = 4). (B) Homing in NSG mice of reisolated CD34+ cells generated in the absence (control) or presence of VPA (7 days) 16 and 48 hours after infusion (mean ± SEM; ****P < 0.0001; *P < 0.05). NSG recipient mice (n = 35).
Figure 4
Figure 4. Effect of VPA on the different cell cycle phases of CD34+CD90+ cells.
(A) Flow cytometric cell cycle analysis of CD34+CD90+ cells following SF culture under control (upper panel: 26.4%) conditions or cultures containing VPA (lower panel: 82.9%) for 7 days, with corresponding dot plots showing cells in different phases of the cell cycle by BrdU pulse labeling (2.5 hours) and staining with 7AAD (G0/G1, S, and G2/M). One of three representative experiments is shown. (B) Percentage of CD34+CD90+ cells that were in different phases of the cell cycle. A significant increase in the number of CD34+CD90+ cells was observed in G0/G1 (*P < 0.05), S (*P < 0.05), and G2/M (****P < 0.0001) phases in the VPA-containing cultures (mean ± SD; ANOVA, P < 0.002; n = 3).
Figure 5
Figure 5. Effect of VPA on the ex vivo expansion of CB CD34+ and CD34+CD90+ cells in the absence of cytokines.
(A) PCs were primed with cytokines as indicated in Figure 1A and treated for 7 days under SF culture conditions in media alone or VPA alone without additional cytokines. Both cultures containing media alone (No cytokines) and VPA alone (No cytokines) led to a significantly greater number of CD34+ and CD34+CD90+ cells as compared with PCs. ****P < 0.0001; *P < 0.05 (mean ± SEM; ANOVA, P < 0.0001; n = 6). (B) A significant difference was observed in the fold increase of CD34+ and CD34+CD90+ cells in the SF cultures containing media alone (no cytokines) versus those with VPA alone (no cytokines). *P < 0.05; **P < 0.005 (mean ± SEM; ANOVA, P < 0.0001; n = 6).
Figure 6
Figure 6. Effect of HDACIs on HDAC protein expression levels.
CB-MNCs were freshly isolated and treated in the absence and presence of SCR, C433, or VPA for 24 hours. Total cell lysates were prepared, and Western blotting was performed using HDAC mAbs specific to class I (HDAC1, -2, and -3), class IIa (HDAC4 and -5), and class IIb (HDAC6) HDACs as described in Methods. β-Actin was used as a loading control. One of four representative experiments is shown. Un-, untreated freshly isolated CB-MNCs.
Figure 7
Figure 7. ALDH functional activity in expanded CB CD34+ cells.
(A) PCs treated under control conditions or with VPA for 7 days with cytokines were assessed for ALDH activity. Contour plot analyses of various populations of cells including ALDH+CD34+ cells (left panel) and ALDH+ cells (middle panel). ALDH+ cells (blue box) were gated for coexpression of CD34 and c-Kit (CD117) (right panel). A greater degree of ALDH activity was observed in SF versus SC control cultures (P = 0.005) as well as in VPA-containing cultures (P = 0.001). Similarly, the percentage of ALDH+CD34+ and ALDH+CD34+CD117+ cells was significantly greater in SF than in SC cultures (P = 0.001 and P = 0.007, respectively). One of 3 to 5 representative experiments is shown. (B) A far greater number of ALDH+CD34+CD117+ cells was generated in the presence of VPA in SF cultures as compared with that in SC cultures (mean ± SEM; *P < 0.05; **P < 0.005; ANOVA, P = 0.009; n = 3–5).
Figure 8
Figure 8. Transcripts of pluripotency genes in VPA-expanded CD34+ cells.
(A) Expression of pluripotency genes in VPA-treated CD34+ cells. CD34+ cells were reisolated after treatment in the presence or absence of VPA in SF and SC cultures. cDNA was prepared from total RNA, and RT-PCR was performed. ES cells were a positive control for SOX2, OCT4, and NANOG transcripts and a negative control for CD34 expression. Expression of pseudo-OCT4 was not detected by RT-PCR in VPA-treated CD34+ cells under SF culture conditions. Lanes for control/VPA (SF) and VPA (SC)/ES cells were run on two different gels, and lanes for the pseudo- and genuine OCT4 gene were run on a single gel. GAPDH housekeeping gene, M-a 50-bp DNA ladder. One of four representative experiments is shown. (B) Quantitation of the effects of VPA on genes associated with pluripotency. CD34+ cells cultured under different conditions were isolated and processed as described in A. Relative transcript levels of SOX2, OCT4, and NANOG genes were calculated by SYBR Green qPCR. Fold change of mRNA expression by CD34+ cells reisolated from control cultures (left panel) and VPA-containing cultures (right panel) was calculated by normalizing to the level of corresponding transcripts present in PCs (mean ± SD; ANOVA, P = 0.0001; n = 4). (C) Quantitation of expression of genes associated with chromatin remodeling and pluripotency after VPA treatment under SF or SC culture conditions. Fold change of SET, MYST3, SMARCAD1, and ZIC3 mRNA expression levels was calculated as described above (mean ± SEM; ANOVA, P = 0.04; n = 3).
Figure 9
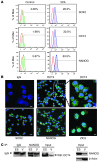
Figure 9. Expression of pluripotency genes in VPA-expanded CD34+ cells.
(A) Representative flow cytometric analysis of SOX2, OCT4, and NANOG expression in reisolated CD34+ cells after 7 days of culture under control conditions or after exposure to VPA. Cells were fixed, permeabilized, and stained with isotype-matched IgG (red line) or SOX2, OCT4, and NANOG mAbs to assess the intracellular levels of protein in reisolated CD34+ cells from control (green line) and VPA (blue line) cultures. One of four representative experiments is shown. (B) Confocal microscopic analysis of pluripotency gene expression. CD34+ cells were reisolated after treatment with VPA in SF cultures and immunostained with isotype-matched IgG or OCT4, SOX2, NANOG, and ZIC3 antibodies (FITC, green) as described in Methods. Nuclei were stained with DAPI (blue). Shown is a single optical section of confocal z-stack series (scale bars: 10 μm) for OCT4, SOX2, and NANOG (original magnification, ×63) and IgG and ZIC3, as well as a higher magnification (×126) of OCT4. One of three representative experiments is shown. (C) Co-IP of pluripotency genes. ES (H9) cells and progeny of the VPA-treated cells (V) were lysed on day 7, and ES or V cell lysates were IP with NANOG pAb (or anti-IgG control) and fractionated by SDS-PAGE. Total protein lysates (input) from ES and VPA-treated cells were also included in the same gel but were noncontiguous. Western blot (WB) analysis was performed using an OCT4 pAb. Western blot analysis using NANOG mAb was also performed on ES and VPA-treated cell lysates. β-Actin was used as a loading control. One of three representative experiments is shown.
Figure 10
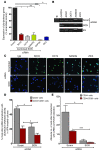
Figure 10. siRNA-mediated knock down of pluripotency genes.
(A) PCs were treated with VPA in SF cultures. After 3 days, cells were transfected with a pool of SOX2, OCT4, NANOG (SON), scrambled (negative control), and GAPDH siRNA (positive control) as described in Methods. SOX2, OCT4, NANOG, GAPDH, and ZIC3 transcripts were quantitated by SYBR Green qPCR and normalized to the level of CD34 transcripts *P < 0.05; **P ≤ 0.006; ***P = 0.0001 (mean ± SEM; ANOVA, P < 0.0001; n = 3). (B) Expression of SOX2, OCT4, NANOG, CD34, and GAPDH following siRNA-mediated knock down was analyzed by RT-PCR. M, DNA markers. ES cells were a positive control for SOX2, OCT4, NANOG, and ZIC3. Lanes were run on the same gel. (C) Pluripotency gene expression was analyzed by confocal microscopy. Upper panel: scrambled siRNA; lower panel: SON siRNA showing SOX2, OCT4, NANOG, and ZIC3 expression in VPA-treated cells. Images represent an optical section of confocal z-stack series. Scale bars: 10 μm (original magnification, ×40). Similar data were obtained in two additional experiments. (D) After 7 days of transfection, the percentage of cells that were CD34+ and CD34+CD90+ was analyzed using flow cytometry. Graph represents a comparative analysis of the percentage of CD34+ and CD34+CD90+ cells generated in VPA cultures after transfection with siRNA including scrambled and SON. *P ≤ 0.05 (mean ± SEM; ANOVA, P = 0.0005; n = 3). (E) Absolute numbers of CD34+ and CD34+CD90+ cells per CB collection generated in VPA-containing cultures following transfection with scrambled or SON siRNA were calculated. *P ≤ 0.05; ***P = 0.0001 (mean ± SEM; ANOVA, P = 0.0008; n = 3).
Figure 11
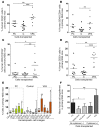
Figure 11. Analysis of human cell chimerism in primary NSG mice.
NSG mice were transplanted with PCs, CD34+ cells reisolated from control cultures, and VPA-containing cultures. Mean ± SD percentage of chimerism with (A) human cells (CD45+), (B) CD45+CD34+ cells, (C) CD34+CD184+ cells, (D) CD33+ cells, (E) megakaryocytes (CD41+), erythroid cells (GPA+), granulocytes (CD14+), T cells (CD3+), and B cells (CD19+) was determined by flow cytometry. (F) Comparative analysis of the mean degree of human cell chimerism achieved with transplantation of PCs and CD34+ cells treated in the absence or presence of cytokines under SF culture conditions with or without VPA. (A) **P = 0.006; ***P = 0.0008 (ANOVA, P < 0.0001); (B) **P = 0.004 (ANOVA, P = 0.03); (C) *P = 0.01; **P = 0.0008 (ANOVA, P = 0.01); (D) **P = 0.003; ****P < 0.0001 (ANOVA, P < 0.0001); (E) median ± SD. *P < 0.05; **P < 0.005 (ANOVA, P < 0.0001); and (F) *P < 0.05, one-tailed t test. **P ≤ 0.002 (ANOVA, P < 0.0001). n = 27 NSG recipient mice.
Figure 12
Figure 12. Analysis of human cell chimerism in secondary NSG mice.
(A and B)Thirteen to 14 weeks after transplantation of PCs or grafts expanded for 7 days under the various conditions previously described, the primary recipient mice were sacrificed, and 2 × 10⁶ BM cells were transplanted into secondary NSG mice. Each bar represents the median percentage of human donor cell engraftment that occurred in the marrow of the secondary NSG mice as determined by mAb staining and flow cytometric analysis and the multilineage hematopoietic cell engraftment that occurred in secondary NSG mice 15–16 weeks after transplantation of different types of grafts from primary recipients. Patterns of lineage development were statistically significantly different: *P < 0.05; **P < 0.005. Median ± SD (A and B). ANOVA, P < 0.0001. n = 18 NSG recipient mice.
Figure 13
Figure 13. Comparison of the frequency of SRCs in PCs and the progeny of an equivalent number of CD34+ cells cultured under control conditions or treated with VPA.
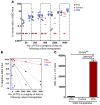
(A) Increasing numbers of PCs (50, 250, 500, 2,500, and 5,000) and the progeny of cultures initiated with an equivalent number of cells cultured under control conditions or in the presence of VPA were individually transplanted into NSG mice. Percentage of human CD45+ cell engraftment in the BM of recipient mice after 12 to 13 weeks is shown. (B) Poisson statistical analysis was performed using the number of mice with or without evidence of human cell engraftment (Table 4). Graph represents the percentage of mice without human cell chimerism (negative) following the transplantation of PCs or the progeny of equivalent numbers of CD34+ cells from control cultures or cultures containing VPA. Dotted lines represent 95% CIs. (C) SRC numbers were calculated using Poisson statistical analysis and are represented as the number of SRCs per 1 × 10⁶ CD34+ cells. **P ≤ 0.002; ANOVA, P = 0.003. n = 111 NSG recipient mice.

Comment in

Similar articles

Cited by

References

    1. Cairo MS, Wagner JE. Placental and/or umbilical cord blood: an alternative source of hematopoietic stem cells for transplantation. Blood. 1997;90(12):4665–4678. - PubMed
    1. Dahlberg A, Delaney C, Bernstein ID. Ex vivo expansion of human hematopoietic stem and progenitor cells. Blood. 2011;117(23):6083–6090. doi: 10.1182/blood-2011-01-283606. - DOI - PMC - PubMed
    1. Delaney C, Bollard CM, Shpall EJ. Cord blood graft engineering. Biol Blood Marrow Transplant. 2013;19(1 suppl):S74–S78. doi: 10.1016/j.bbmt.2012.10.015. - DOI - PMC - PubMed
    1. Navarrete C, Contreras M. Cord blood banking: a historical perspective. Br J Haematol. 2009;147(2):236–245. doi: 10.1111/j.1365-2141.2009.07827.x. - DOI - PubMed
    1. Stanevsky A, Goldstein G, Nagler A. Umbilical cord blood transplantation: pros, cons and beyond. Blood Rev. 2009;23(5):199–204. doi: 10.1016/j.blre.2009.02.001. - DOI - PubMed

Publication types

MeSH terms

  NODES
twitter 2