. 2015 Jan;29(1):27-37.
doi: 10.1038/leu.2014.149. Epub 2014 May 5.

Identification of Wee1 as a novel therapeutic _target for mutant RAS-driven acute leukemia and other malignancies

Affiliations

Identification of Wee1 as a novel therapeutic _target for mutant RAS-driven acute leukemia and other malignancies

Ellen Weisberg et al. Leukemia. 2015 Jan.

Abstract

Direct _targeting of rat sarcoma (RAS), which is frequently mutated, has proven to be challenging, and inhibition of individual downstream RAS mediators has resulted in limited clinical efficacy. We designed a chemical screen to identify compounds capable of potentiating mammalian _target of rapamycin (mTOR) inhibition in mutant RAS-positive leukemia, and identified a Wee1 inhibitor. Synergy was observed in both mutant neuroblastoma RAS viral oncogene homolog (NRAS)- and mutant kirsten RAS viral oncogene homolog (KRAS)-positive acute myelogenous leukemia (AML) cell lines and primary patient samples. The observed synergy enhanced dephosphorylation of AKT, 4E-binding protein 1 and s6 kinase, and correlated with increased apoptosis. The specificity of Wee1 as the _target of MK-1775 was validated by Wee1 knockdown, as well as partial reversal of drug combination-induced apoptosis by a cyclin-dependent kinase 1 (CDK1) inhibitor. Importantly, we also extended our findings to other mutant RAS-expressing malignancies, including mutant NRAS-positive melanoma, and mutant KRAS-positive colorectal cancer, pancreatic cancer and lung cancer. We observed favorable responses with combined Wee1/mTOR inhibition in human cancer cell lines from multiple malignancies, and inhibition of tumor growth in in vivo models of mutant KRAS lung cancer and leukemia. The present study introduces for the first time Wee1 inhibition combined with mTOR inhibition as a novel therapeutic strategy for the selective treatment of mutant RAS-positive leukemia and other mutant RAS-expressing malignancies.


Figures

Figure 1
Figure 1. Identification of Wee1 inhibitor, MK-1775, as able to potentiate the effects of mTOR inhibition against mutant NRAS-expressing cells via inhibition of AKT, 4E-BP1, and S6K phosphorylation
(A) Schematic of LINCS library chemical screen. 384-well plates were seeded with either parental Ba/F3 cells cultured in the presence of 15% WEHI (as a source of IL-3), which were used as a control to eliminate inhibitors that exhibit off-_target toxicity and interfere with IL-3-mediated signaling, or Ba/F3-NRAS- G12D cells (growth factor-independent). Included in the screen were cell-containing plates that only received LINCS library drugs (300 nM, determined to be the optimal screening concentration) for the purpose of assessing single agent activity of the LINCS library compounds, or plates that contained LINCS library compounds (300 nM) plus the mTOR inhibitor, Torin 1 (20 nM, which was determined to be close to the IC50 against mutant NRAS-expressing cells). DMSO (vehicle) wells and Torin 1-only wells were included as controls in the plates. Following pintool administration of the library compounds, the 384-well plates were incubated for two days prior to administration of Cell Titer Glo (Promega, Madison, WI) and analysis of bioluminescence using a plate reader. Ideal candidates for further investigation were LINCS library compounds showing minimal activity as single agents against parental Ba/F3 cells, yet potentiation of the efficacy of Torin 1 against NRAS-driven cells. “Hits” were validated for synergizing potential using several approaches, including cellular proliferation assays, signaling studies, and in vivo analysis. (B-E) Approximately two-day proliferation studies performed with MK-1775, combined with AZD8055 or WYE-125132 against parental Ba/F3 and Ba/F3-NRAS-G12D cells. (F-H) Effect of approximately two-hr treatment of Ba/F3 or Ba/F3-NRAS-G12D cells with MK-1775 (75 nM), alone and combined with mTOR inhibitor, AZD8055 (20 nM), on phosphorylation of 4E-BP1, AKT, and S6K, as measured by immunoblotting.
Figure 2
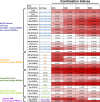
Figure 2. Combination indices for proliferation studies testing MK-1775 alone and combined with _targeted inhibitors of mutant RAS signaling
MK-1775 is abbreviated as “MK.” Values less than 0.9 indicate synergy and are in shades of red (darker shades mean higher synergy). Values greater than 0.9 do not indicate synergy and are colored white. Mutant RAS-expressing Ba/F3 cells are shown in dark blue font. Parental Ba/F3 cells are shown in light blue font. Mutant NRAS-positive melanoma cell lines are shown in orange font. Mutant KRAS-positive colorectal cancer cell lines are shown in dark green font. Mutant KRAS-expressing pancreatic cancer cell lines are shown in light green font. Primary AML patient cells are shown in dark purple font.
Figure 3
Figure 3. Combined Wee1 and TORC inhibition is effective against Ba/F3-KRAS-G12D expressing cells and induces apoptosis in mutant NRAS- and mutant KRAS-expressing cells
(A-B) Approximately two-day proliferation studies performed with MK-1775, combined with AZD8055 or WYE-125132 against Ba/F3-KRAS-G12D cells. (C-E) Effect of approximately two-hr treatment of Ba/F3-KRAS-G12D cells with MK-1775 (75 nM), alone and combined with mTOR inhibitor, AZD8055 (20 nM), on phosphorylation of 4E-BP1, AKT, and S6K, as measured by immunoblotting. (F) Approximately three-day treatment of Ba/F3, Ba/F3-NRASG12D, and Ba/F3-KRAS-G12D cells, respectively, with MK-1775 (75 nM), AZD8055 (20 nM), WYE125132 (20 nM), or a combination of MK-1775+AZD8055 or MK-1775+WYE125132 prior to analysis of apoptotic death.
Figure 4
Figure 4. MK-1775 selectively potentiates the anti-leukemic effects of mTOR inhibition on proliferation of human mutant KRAS-expressing AML cells via induction of apoptosis
(A-C) Dose-response curves for mutant KRAS-expressing human AML cells (SKM-1, Nomo-1, and NB4) showing single agent versus drug combination effects following approximately three days of treatment. (D) Calcusyn combination indices derived from six-point concentration proliferation experiments. The cut-off for nearly additive effects (C.I.: 1.1) is marked by a dashed line. (E) Approximately three-day treatment of HEL, Nomo-1, and NB4 cells, respectively, with MK-1775 (75 nM), Torin 2 (20 nM), or a combination of MK-1775+Torin 2 prior to analysis of apoptotic death. (F) Immunoblot showing effect of MK-1775+/-Torin 2 on PARP cleavage HEL and NB4 cells.
Figure 5
Figure 5. Wee1 kinase is the main _target of MK-1775 that mediates synergy with TORC inhibitors
(A, C) Effect of approximately two hr treatment of Ba/F3-NRAS-G12D cells or NB4 cells with MK-1775 on phosphorylation of cdc2 (CDK1), as measured by immunoblotting. (B) NRAS expression in Ba/F3 versus Ba/F3-NRAS-G12D cells. (D) Measurement of apoptosis following approximately 48 hour treatment of NB4 cells with MK-1775, Torin 2, MK-1775+Torin 2, or MK-1775+Torin 2 in the presence of a CDK1 inhibitor at the indicated concentrations. (E) Proliferation of approximately 48 hour MK-1775 (75 nM)- and Torin 2 (20 nM)-treated NB4 cells following KD of Wee1 by shRNA (hp2) as compared to GFP control. (F) Validation of Wee1 KD efficiency in NB4 cells.
Figure 6
Figure 6. MK-1775 selectively potentiates the anti-leukemic effects of mTOR inhibition on proliferation of human mutant NRAS-expressing acute leukemia cells
(A-E) Dose-response curves for mutant NRAS-expressing acute leukemia cells (PF-382, NALM6, P31-FUJ) or wt RAS-expressing acute leukemia cells (HEL, MOLM14) showing single agent (MK-1775 or WYE125132) versus drug combination effects following approximately two days of treatment. (F) Calcusyn combination indices derived from six-point concentration proliferation experiments. The cut-off for nearly additive effects (C.I.: 1.1) is marked by a dashed line. (G-H) Mutant NRAS-positive AML patient samples treated with MK-1775, WYE125132, or a combination of both.
Figure 7
Figure 7. In vivo investigation of the combined effects of Wee1 and mTOR inhibition in murine models of active KRAS
(A) Calcusyn combination indices derived from six-point concentration proliferation experiments, investigating the combination of MK-1775 and mTOR inhibitors against human active KRAS-expressing lung cancer cell lines. The cut-off for nearly additive effects (C.I.: 1.1) is marked by a dashed line. (B) In vivo effects of Torin 2 (20mg/kg 1X daily), MK-1775 (10mg/kg 1X daily), or a combination of the two agents using an inducible active KRAS model of lung cancer. Each column represents tumor volume changes after 2 weeks of indicated treatment for an individual mouse by comparing total lung tumor volume before and after treatment. Negative and positive percentage indicates tumor regression and progression respectively. A two-tailed t test was used to calculate the p value between treatment groups. (C) Representative MRI scans detecting tumor burden changes before and after indicated treatments. Arrows, tumors; H, Heart. (D-F) In vivo effects of Torin 2, MK-1775, or a combination of the two agents using a murine model of mutant KRAS-positive leukemia. (D) Mouse bioluminescence images taken before treatment (baseline) and after one week of drug treatment of NSG mice harboring NB4-luc+ cells. (E) Bioluminescence values plotted over time for single agent- and combination-treated mice. (F) Fold leukemia induction plotted over time for single agent- and combination-treated mice. Combination-treated mice were tested in a pilot titration study testing for Torin 2 tolerance/toxicity in which they received 0, 5, or 10mg/kg Torin 2 1X daily for 1 week prior to tail vein-injection of NB4-luc+ cells. Drug administration was terminated several days prior to cell inoculation and observed to have no influence on starting leukemia burden.

Similar articles

Cited by

References

    1. Downward J. _targeting RAS signalling pathways in cancer therapy. Nat Rev Cancer. 2003;3:11–22. - PubMed
    1. Bowen DT, Frew ME, Hills R, Gale RE, Wheatley K, Groves MJ, et al. RAS mutation in acute myeloid leukemia is associated with distinct cytogenetic subgroups but does not influence outcome in patients younger than 60 years. Blood. 2005;106:2113–2119. - PubMed
    1. Bacher U, Haferlach T, Schoch C, Kern W, Schnittger S. Implications of NRAS mutations in AML: a study of 2502 patients. Blood. 2006;107:3847–3853. - PubMed
    1. Nakao M, Janssen JW, Seriu T, Bartram CR. Rapid and reliable detection of N-ras mutations in acute lymphoblastic leukemia by melting curve analysis using LightCycler technology. Leukemia. 2000;14:312–315. - PubMed
    1. Ostrem JM, Peters U, Sos ML, Wells JA, Shokat KM. K-RAS (G12C) inhibitors allosterically control GTP affinity and effector interactions. Nature. 2013;503:548–51. - PMC - PubMed

Publication types

MeSH terms

  NODES
admin 3
Idea 1
idea 1
twitter 2