. 2014 Jul 15;193(2):597-609.
doi: 10.4049/jimmunol.1303048. Epub 2014 Jun 13.

Adventitial fibroblasts induce a distinct proinflammatory/profibrotic macrophage phenotype in pulmonary hypertension

Affiliations

Adventitial fibroblasts induce a distinct proinflammatory/profibrotic macrophage phenotype in pulmonary hypertension

Karim C El Kasmi et al. J Immunol. .

Abstract

Macrophage accumulation is not only a characteristic hallmark but is also a critical component of pulmonary artery remodeling associated with pulmonary hypertension (PH). However, the cellular and molecular mechanisms that drive vascular macrophage activation and their functional phenotype remain poorly defined. Using multiple levels of in vivo (bovine and rat models of hypoxia-induced PH, together with human tissue samples) and in vitro (primary mouse, rat, and bovine macrophages, human monocytes, and primary human and bovine fibroblasts) approaches, we observed that adventitial fibroblasts derived from hypertensive pulmonary arteries (bovine and human) regulate macrophage activation. These fibroblasts activate macrophages through paracrine IL-6 and STAT3, HIF1, and C/EBPβ signaling to drive expression of genes previously implicated in chronic inflammation, tissue remodeling, and PH. This distinct fibroblast-activated macrophage phenotype was independent of IL-4/IL-13-STAT6 and TLR-MyD88 signaling. We found that genetic STAT3 haplodeficiency in macrophages attenuated macrophage activation, complete STAT3 deficiency increased macrophage activation through compensatory upregulation of STAT1 signaling, and deficiency in C/EBPβ or HIF1 attenuated fibroblast-driven macrophage activation. These findings challenge the current paradigm of IL-4/IL-13-STAT6-mediated alternative macrophage activation as the sole driver of vascular remodeling in PH, and uncover a cross-talk between adventitial fibroblasts and macrophages in which paracrine IL-6-activated STAT3, HIF1α, and C/EBPβ signaling are critical for macrophage activation and polarization. Thus, _targeting IL-6 signaling in macrophages by completely inhibiting C/EBPβ or HIF1α or by partially inhibiting STAT3 may hold therapeutic value for treatment of PH and other inflammatory conditions characterized by increased IL-6 and absent IL-4/IL-13 signaling.


Figures

Figure 1
Figure 1. Adventitial macrophages in various forms of PH express CD163
(A) Accumulation of CD163-positive (human, calf) and ED2-positive (CD163 analog in rats) cells (red fluorescence) in human, calf and rat PAs. Note localization to the PA adventitia (Adv). All panels show DAPI counterstain (cell nuclei, blue) and autofluorescence of vascular elastic lamellae (green) defining borders of vascular media. Cryosections of hilar (human) or intra-lobar (calf, rat) PAs were immunostained. Controls (human donors or normoxic animals); iPAH (idiopathic pulmonary arterial hypertension), Hypoxic (experimental chronic hypoxia-induced PH), MCT (monocrotaline-induced PH). AW = airway; M = PA media. Scale bars = 100 µm (B) Immunostaining for phosphorylated STAT3 and IL6 in formalin-fixed tissue from patients with iPAH and donor(s) as controls. Note adventitial staining for phosphorylated STAT3 and IL6 in PA from patients with iPAH (arrowheads). Images are representative of 8 patients and 5 donors. (C) Gene expression of canonical macrophage STAT3-regulated genes, IL4Rα and SOCS3, and the STAT3 inducer IL6, in laser-capture micro-dissected PA tissue from humans with iPAH and controls (Donor, both n= 8) expressed as δCt values normalized to expression of porphobilinogen deaminase (PBGD). *P < 0.05 by unpaired two-tailed Student’s t-test.
Figure 2
Figure 2. Adventitial fibroblasts activate macrophages
(A) Transwell experiment depicting mRNA expression in mouse bone marrow-derived macrophages (mouse BMDMs) exposed to soluble factors generated by distal pulmonary artery (dPA) explants from calves with chronic hypoxia-induced PH. dPAs were isolated such that an intact piece of PA tissue (intact dPA), a PA tissue piece from which the adventitia had been removed (dPA w/o adv.), and the removed adventitia piece itself (dPA adventitia) were incubated in the upper chamber of a 0.4-µm Transwell in the presence of naïve mouse BMDMs (lower chamber) for 16 h prior to RNA isolation and qRT-PCR (as depicted in the diagram). Displayed is the fold-induction (normalized to basal expression) of a representative PCR triplicate (average +/− SEM) from one of two calves. Three dPA segments were tested from each animal.. *P < 0.05 by one-way ANOVA. (B) Gene expression in BMDMs or monocytes exposed to conditioned media (CM) from dPA adventitial fibroblasts (PH-Fibs). Left panels top and bottom: CM from ex vivo-cultured bovine PH-Fibs (cells isolated from the dPA of calves with PH), and not from controls (CO-Fib CM) promotes gene expression of Cd163 (top) and Cd206 (bottom) in naïve mouse and bovine BMDMs; Right panels top and bottom: CM from bovine and human PH-Fibs induce expression of Cd163 and Cd206 in naïve human THP1 monocytes after 16 hrs of exposure. Relative mRNA levels are presented as mean±SEM of PCR triplicates after normalization to Hprt1 expression and relative to gene expression in untreated macrophages/monocytes (basal) and are representative of at least n=5 experiments with CM from at least 3 different PH-Fibs and CO-Fibs populations isolated from at least 3 different animals/patients and using BMDMs from at least 3 different animals. *P < 0.05 by unpaired two-tailed Student’s t-test.
Figure 3
Figure 3. Fibroblast activated adventitial macrophages do not exhibit a canonical alternatively activated phenotype
(A) Soluble factors from the dPA adventitia (using dPA explants and 0.4-µm Transwells as in Fig. 2) induce gene expression of Arg1, but not Chi3l3 and Rentla in mouse BMDMs. Displayed is the fold-induction (normalized to basal expression) of a representative PCR triplicate (average +/− SEM) from one of two calves. Three dPA segments were tested from each animal. *P < 0.05 by one-way ANOVA. (B, C) PH-Fib CM, but not CO-Fib CM induces Arg1, but not Chi3l3 or Rentla gene expression in mouse BMDMs (16 hr time point shown). The effect is similar with media generated from bovine (B) or human (C) PH-FIBs and CO-Fibs. Data are mean ± SEM of PCR triplicates after normalization to expression of Hprt1 and relative to gene expression in untreated macrophages (basal). *P < 0.05 by unpaired two-tailed Student’s t-test. Presented is the result from a representative PH-Fib CM and a representative CO-Fib CM. They are representative of the results observed with 3 different cell populations (from different calves/patients) of each cell phenotype that were tested at least 3 times on BMDMs generated from at least 3 different mice. (D, E). Bovine PH-Fib CM induces comparable transcript levels for Arg1 in WT BMDMs and BMDMs derived from Il4/Il13−/−, Il4ra−/−, or Stat6−/−, and Myd88−/− mice. (F) Arg1 expression in WT BMDMs is significantly attenuated in response to PH-Fib CM in BMDMs from C/ebpβ−/− mice. In D–F, PCR data are mean ± SEM from PCR triplicates after normalization to expression of Hprt1 (16hr time point) and expressed relative to gene expression in untreated macrophages (basal). Displayed are findings representative of experiments with CM from 3 PH-Fib and 3 CO-Fib populations repeated on BMDMs from 3 different animals. *P < 0.05 by one-way ANOVA.
Figure 4
Figure 4. PH-Fibs activate macrophages through paracrine IL6
(A) IL6 protein amounts in CM from 2 bovine PH Fib populations; mean +/− SEM are shown from analysis of triplicate samples of each and compared to IL6 amounts in CM from 2 CO-Fibs, also tested in triplicate; * depicts p< 0.05 by t-test (PH-Fib CM vs. Cntrl CM); and relative IL6 mRNA in bovine CO-Fib (normalized to 1, n=5) vs. PH-Fib (n=4); * depicts p< 0.05 by t-test. (B) siRNA mediated knock down of IL6 transcription in bovine CO-Fibs and PH-Fibs; Scr=scrambled, basal=untreated; and IL6 protein amounts in CM from untreated (basal), scrambled, and IL6 siRNA treated PH-Fibs (n=3 each) tested in triplicate ELISA assay. (C) siRNA-mediated suppression of IL6 gene transcription in bovine PH-Fibs limits the ability of CM to induce transcription of STAT3 regulated genes in WT mouse BMDMs. Gene expression is normalized to expression of Hprt1 and relative to that in macrophages exposed to CM from CO-Fibs treated with control siRNA. Data are mean ± SEM from triplicate determinations and representative of two separate experiments. (D) Expression of STAT3 regulated genes, including Hif1α, in WT and Il6−/− BMDMs exposed for 16 hrs to bovine PH-Fib CM. *P < 0.05 by unpaired two-tailed Student’s t-test of triplicate PCR analysis; one representative experiment with CM from one of three PH-Fib populations was tested on BMDMs from 3 different animals of each genotype.
Figure 5
Figure 5. PIM1 and NFATC2 signaling is promoted in fibroblast-activated macrophages
(A) PIM1 and NFATC2 expression in laser-capture micro-dissected PA tissue from humans with iPAH compared to controls (both n= 8) expressed as δCt values normalized to expression of porphobilinogen deaminase (PBGD). *P < 0.05 by unpaired two-tailed Student’s t-test. (B) Soluble factors from the dPA adventitia (using dPA explants and 0.4-µm Transwells as in Fig. 2) induce gene expression of Pim1 and Nfatc2 in mouse BMDMs. Displayed is the fold-induction (normalized to basal expression) of a representative PCR triplicate (average +/− SEM) from one of two calves. Three dPA segments were tested from each animal; gene expression oafter incubation for 16hrs is shown. *P < 0.05 by one-way ANOVA. (C) Bovine PH-Fib CM induces gene expression of PIM1 and NFATC2 in bovine (16hr time point shown), mouse (D, time course is shown), and rat (E; 16hr time point is shown) BMDMs. (C–E) Displayed are PCR triplicates of a representative experiment with one CO-Fib and one PH-Fib CM (mean ± SEM) normalized to Hprt1 expression and expressed relative to basal (untreated) gene expression. These are representative of 3 experiments with CM from 3 separate CO-Fibs and 3 separate PH-Fibs cell populations on BMDMs from 3 different animals. *P < 0.05 by unpaired two-tailed Student’s t-test. (F) siRNA-mediated suppression of IL6 gene transcription in bovine PH-Fibs limits the ability of CM to induce transcription of Pim1 and Nfatc2 in WT mouse BMDMs. Gene expression is normalized to expression of Hprt1 and relative to that in macrophages exposed to CM from CO-Fibs treated with control siRNA. Data are mean ± SEM from triplicate determinations and representative of two separate experiments. (G) Expression of Pim1 and Nfatc2 in WT and Il6−/− BMDMs exposed for 16 hrs to bovine PH-Fib CM. *P < 0.05 by unpaired two-tailed Student’s t-test of triplicate PCR analysis; one representative experiment with CM from one of three PH-Fib populations was tested on BMDMs from 3 different animals of each genotype.
Figure 6
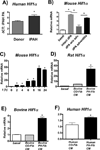
Figure 6. Hif1a is expressed in fibroblast-activated macrophages
(A) HIF1a gene expression in laser-capture micro-dissected PA tissue from humans with iPAH compared to controls (Donor, both n= 8) expressed as δCt values normalized to expression of porphobilinogen deaminase (PBGD). *P < 0.05 by unpaired two-tailed Student’s t-test. (B) Soluble factors from the dPA adventitia (using dPA explants from PH calves and 0.4-µm Transwells, as in Fig 2) induce gene expression of Hif1a in mouse BMDMs. Displayed is the fold-induction (normalized to basal expression) of a representative PCR triplicate (average +/− SEM) from one of two calves. Three dPA segments were tested from each animal; 16hr time point is shown. (C–E) Bovine PH-Fib CM induces gene expression of Hif1a in mouse (C; time course is shown), rat (D; 16 hr time point), and bovine (E; 16hr time point) BMDMs. Displayed are PCR triplicates of a representative experiment with one CO-Fib and one PH-Fib CM (mean ± SEM) normalized to Hprt1 expression and expressed relative to basal (untreated) gene expression. These are representative of 3 experiments with CM from 3 separate CO-Fibs and 3 separate PH-Fibs cell populations on BMDMs from 3 different animals. (F) HIF1a gene expression in human THP1 monocytes exposed to human PH-Fib CM compared to those exposed to human CO-Fib CM. Mean ± SEM of PCR triplicates CM from CO-Fibs and PH-Fibs after normalization to expression of Hprt1 and expressed relative to CO-Fib CM induced gene expression; (16 hr exposure) *P < 0.05 by unpaired two-tailed Student’s t-test (A, F). * P < 0.05 by one-way ANOVA (B–E).
Figure 7
Figure 7. Vegfa is expressed in fibroblast-activated macrophages
(A) Soluble factors from the dPA adventitia (using dPA explants and 0.4-µm Transwells as in Fig. 2) induce gene expression of Vegfa in mouse BMDMs. Displayed is the fold-induction (normalized to basal expression) of a representative PCR triplicate (average +/− SEM) from one of two calves. Three dPA segments were tested from each animal; (16hr time point). (B–D) Bovine PH-Fib CM induces gene expression of Hif1a in mouse (B; time course is shown), Rat (C; 16 hr time point), and bovine (D; 16hr time point) BMDMs. Displayed are PCR triplicates of a representative experiment with one CO-Fib and one PH-Fib CM (mean ± SEM) normalized to Hprt1 expression and expressed relative to basal (untreated) gene expression. These are representative of 3 experiments with CM from 3 separate CO-Fibs and 3 separate PH-Fibs cell populations on BMDMs from 3 different animals. (E) VEGFa gene expression in human THP1 monocytes exposed to human PH-Fib CM compared to those exposed to human CO-Fib CM. In E one representative experiment with CM from CO-Fibs and PH-Fibs isolated of at least 3 different patients/controls is shown. Data were obtained 16hrs after stimulation. *P < 0.05 by ANOVA
Figure 8
Figure 8. STAT3, C/EBPb, and HIF1a are critical regulators of fibroblast-mediated macrophage activation
(A) Transcription of Arg1, Il4ra, Socs3, Pim1, and Nfatc2 in BMDMs from Stat3fl/flTie2cre (designated Stat3−/−) mice compared to BMDMs from WT mice (Stat3+/+) and from Stat3fl/+Tie2cre (designated Stat3+/−) in response to bovine PH-Fib CM and recombinant bovine IL6 (2ng/ml) after stimulation for 16 hrs. (B) STAT1 _target gene expression (Ip10 and Irf1) in Stat3−/− compared to WT BMDMs in response to bovine PH-Fib CM after stimulation for 16 hrs. (C) STAT1 _target gene expression (Ip10) in response to stimulation with mouse recombinant IL6 (top panel), or mouse recombinant IFNγ (bottom panel) in Stat3−/− compared to WT BMDMs. (D) Percent gene expression of Il1b in WT, Stat3+/−, and Stat3−/− BMDMs in response to LPS (100ng/ml)+IL10 (10ng/ml) compared to LPS (100ng/ml) alone (set as 100%) after 16 hrs of incubation. (E) Gene expression of Pim1, Nfatc2, Hif1a, Il4ra, Socs3, and Vegfa in C/ebpb−/− mouse BMDMs compared to WT BMDM in response to bovine PH-Fib CM after 16hrs of stimulation. (F) Expression of Arg1 in LysMcre (designated Hif1a+/+) and Hif1afl/flLysMcre (designated Hif1a−/−) mouse BMDMs in response to mouse recombinant IL6 (after stimulation for 16hrs) in the presence or absence of HIF stabilization with DMOG. Data are obtained from PCR triplicates and representative of results obtained from at least two different PH-Fib isolates and BMDMs from 2 different animals. *P < 0.05 by unpaired two-tailed Student’s t-test. *P < 0.05 by unpaired two-tailed Student’s t-test.

Similar articles

Cited by

References

    1. Morrell NW, Archer SL, Defelice A, Evans S, Fiszman M, Martin T, Saulnier M, Rabinovitch M, Schermuly R, Stewart D, Truebel H, Walker G, Stenmark KR. Anticipated classes of new medications and molecular _targets for pulmonary arterial hypertension. Pulmonary circulation. 2013;3:226–244. - PMC - PubMed
    1. Price LC, Wort SJ, Perros F, Dorfmuller P, Huertas A, Montani D, Cohen-Kaminsky S, Humbert M. Inflammation in pulmonary arterial hypertension. Chest. 2012;141:210–221. - PubMed
    1. Savai R, Pullamsetti SS, Kolbe J, Bieniek E, Voswinckel R, Fink L, Scheed A, Ritter C, Dahal BK, Vater A, Klussmann S, Ghofrani HA, Weissmann N, Klepetko W, Banat GA, Seeger W, Grimminger F, Schermuly RT. Immune and inflammatory cell involvement in the pathology of idiopathic pulmonary arterial hypertension. American journal of respiratory and critical care medicine. 2012;186:897–908. - PubMed
    1. Stacher E, Graham BB, Hunt JM, Gandjeva A, Groshong SD, McLaughlin VV, Jessup M, Grizzle WE, Aldred MA, Cool CD, Tuder RM. Modern age pathology of pulmonary arterial hypertension. American journal of respiratory and critical care medicine. 2012;186:261–272. - PMC - PubMed
    1. Stenmark KR, Meyrick B, Galie N, Mooi WJ, McMurtry IF. Animal models of pulmonary arterial hypertension: the hope for etiological discovery and pharmacological cure. American journal of physiology. Lung cellular and molecular physiology. 2009;297:L1013–L1032. - PubMed

Publication types

MeSH terms

Substances

  NODES
Association 2
Note 2
twitter 2