. 2014 Aug 7;15(2):199-214.
doi: 10.1016/j.stem.2014.05.009. Epub 2014 Jun 19.

Dynamic changes in intracellular ROS levels regulate airway basal stem cell homeostasis through Nrf2-dependent Notch signaling

Affiliations

Dynamic changes in intracellular ROS levels regulate airway basal stem cell homeostasis through Nrf2-dependent Notch signaling

Manash K Paul et al. Cell Stem Cell. .

Abstract

Airways are exposed to myriad environmental and damaging agents such as reactive oxygen species (ROS), which also have physiological roles as signaling molecules that regulate stem cell function. However, the functional significance of both steady and dynamically changing ROS levels in different stem cell populations, as well as downstream mechanisms that integrate ROS sensing into decisions regarding stem cell homeostasis, are unclear. Here, we show in mouse and human airway basal stem cells (ABSCs) that intracellular flux from low to moderate ROS levels is required for stem cell self-renewal and proliferation. Changing ROS levels activate Nrf2, which activates the Notch pathway to stimulate ABSC self-renewal and an antioxidant program that scavenges intracellular ROS, returning overall ROS levels to a low state to maintain homeostatic balance. This redox-mediated regulation of lung stem cell function has significant implications for stem cell biology, repair of lung injuries, and diseases such as cancer.


Figures

Figure 1
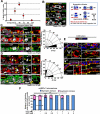
Figure 1. ROS flux from Low to Moderate Levels is Associated with Proliferation of ABSCs
(A) IF imaging of airway epithelium showing in vivo ROS. Left panels show the location of ABSCs (green), ciliated (yellow) and club cells (red). Dotted white lines show the basement membrane. Right panels show in vivo ROS staining of uninjured airway epithelium with DHE (Hydroethidine), dotted yellow lines outline the ABSCs and dotted red lines outline some differentiated cells. ROShi ABSCs (yellow arrows) and ROSlo ABSCs (white arrows) are shown. Nuclei are stained with Hoechst dye (lower panels). (B) Mouse ABSCs (mABSCs) and human ABSCs (hABSCs) were FACS sorted on the basis of endogenous levels of ROS using H2DCFDA and seeded in tracheosphere cultures. (C) Bright field images of the primary tracheospheres (P0) at day 14 of culture. (D) Primary mouse tracheospheres (P0) derived from ROSlo mABSCs were dissociated after 14 days in culture and re-sorted into ROSlo and ROShi populations and placed into the tracheosphere assay again. Serial passages were performed for 3 generations (P1-P3). Graph represents number of tracheospheres formed as a percentage of total number of mABSCs seeded. (E) Effect of ROS modulation on tracheosphere formation of ROSlo mABSCs. Bar graphs represent the number of tracheospheres formed as a percentage response to exogenous NAC and H2O2 treatment in comparison to control (dotted line). (F) Bar graph representing diameter of mouse tracheospheres treated with H2O2. (G) Bar graph representing relative percentage of dividing K5+ SCs and K8+ EP cells in sphere cultures treated with varying concentrations of H2O2 and NAC. (H) Effect of ROS modulation on tracheosphere formation of ROShi mABSCs. Bar graphs represent the number of tracheospheres formed in response to exogenous NAC or H2O2 in comparison to control untreated ROSlo mABSC (dotted line). All data are presented as mean ± SEM. * P < 0.05, ** P < 0.01 and *** P < 0.001. See also Figure S1.
Figure 2
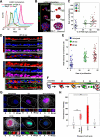
Figure 2
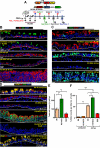
Characterization of the Polidocanol In Vivo Airway Epithelial Injury Model and Elucidation of Symmetrical Versus Asymmetrical ABSC Division During Repair After Injury (A) Graph representing the time course of in vivo epithelial proliferation for repair (% of BrdU+ve epithelial cells as compared to all DAPI+ nuclei) at different hpi. Data are presented as mean ± SEM, (n = 10). (B) DAPI staining of metaphase chromosomes and γ-tubulin immunostaining of centromeres in ABSCs (yellow arrows) demonstrates the plane of polarity for symmetrical versus asymmetrical division. Cartoon of symmetrical versus asymmetrical division. SC= stem cell, PC = progenitor cell, BM= basement membrane. (C, D) The number of symmetrical versus asymmetrical cell divisions in the repairing airway epithelium at 24 hpi (C) and 48 hpi (D) was quantified with γ-tubulin and the polarity marker aPKC in radial histograms where symmetric divisions have spindle angles of 0 ± 30° while asymmetric divisions have spindle angles of 90 ± 30° in relation to the basement membrane. (E) Symmetric and asymmetric division of mABSCs in tracheosphere cultures. γ-tubulin (white), K5 (red) (F) Quantification of the spindle angle of dividing mABSCs in sphere cultures in the presence of varying concentrations of NAC and H2O2. All data are presented as mean ± SEM. * P < 0.05, ** P < 0.01 and *** P < 0.001. See also Figure S2.
Figure 3
Figure 3. ROS flux from Low to Moderate Levels is Associated with ABSC Proliferation and Cell Cycle Progression
(A) Representative FACS plot of ROS level, H2DCFDA stained tracheospheres from ROSlo mABSCs at different days in culture (proliferation phase, 3, 5, 7 days). (B) Proliferation measured in spheres from different days in culture with EdU staining. (C) Scattered correlation plot of the increase in ROS at different days (% ROS high population) with the corresponding proliferation rate (EdU+/DAPI+ nuclei). The correlation was assessed using Spearman's rank correlation coefficient. A significant positive correlation was observed (rho=0.505, p<0.001). (D) IF imaging of airway epithelium showing in vivo ROS (DHE; red) at 24 and 48 hpi. Nuclei (Hoechst), K5 (red) and K8 (green). (E) Scattered correlation plot of the increase in ROS from uninjured to 24 and 48 hpi of the ABSCs in vivo (% ROS high population) with the corresponding proliferation rate (EdU+/DAPI+ nuclei) at same time points. The correlation was assessed using Spearman's rank correlation coefficient. A significant positive correlation was observed (rho=0.505, p<0.001). (F) Schematic representation of FUCCI transfected cells at different stages of cell cycle. mABSCs with cell cycle specific FUCCI markers and ROS levels at different phases of cell cycle progression. G1 (nucleus red, marked by Cdt1-RFP), G1-S initiation (nucleus reddish orange, Cdt1-RFP and Geminin-GFP), G1-S (nucleus orange, Cdt-RFP and Geminin GFP) and M (nucleus green, Geminin GFP), (R: red, G: green). ROS status (CellROX Deep Red dye (white dots)), nuclei (Hoechst (B: blue)). (G) 3D merged representative images of mABSCs (n=300) at different stages of cell cycle with their corresponding ROS status. (H) Correlation between phase of cell cycle and ROS levels was assessed with a Kruskal-Wallis (KW) test. After the significant overall KW test (p<0.001), follow-up Wilcoxon rank-sum tests were utilized to assess which phases were different. This post-hoc analysis yielded statistically significant differences as shown. See also Figure S3.
Figure 4
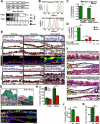
Figure 4. ROS flux Mediates Nrf2-induced ABSC Proliferation
(A) Representative WB for NQO1 and Keap1 expression from Nrf2−/− ABSCs and ABSCs from serial days in tracheosphere cultures (days 3, 5 and 7) Lower panel shows relative densitometric values compared with the basal levels in Nrf2−/− cells. (B) Upper panel shows a representative FACS plot of H2DCFDA stained Nrf2−/− mABSCs. Lower panel shows a representative FACS plot of H2DCFDA stained hABSCs treated with Nrf2 specific siRNA and scrambled (SCR) siRNA. (C) Graph represents number of spheres formed with sorted mABSCs from Nrf2−/− mice as compared to Wt mice and human sorted ABSCs transfected with Nrf2 siRNA and SCR siRNA . (D) Graph represents number of spheres formed with FACS sorted Nrf2−/− mABSCs treated with different doses of NAC and a PAN caspase inhibitor. (E) Immunohistochemistry for Nrf2 and NQO1 expression in the uninjured airway epithelium and at 24 and 48 hpi with isotype controls. IF for differentiation markers CC10 and acetylated β-tubulin at 24 and 48 hpi.. (F) Upper panel shows the histology of uninjured Wt mouse airway epithelium and the histology at 12 and 48 hpi. Lower panel shows the histology of uninjured Nrf2−/− mouse airway epithelium and the histology at 12 and 48 hpi. (G) Pseudo-colored TEM images of repairing airway epithelium at 48 hpi in Wt and Nrf2−/− mice. mABSCs (purple), EP(green). (H) Quantification of number of K5+ mABSCs at 12 and 48 hpi in Nrf2−/− vs Wt mice. (I) IF of Wt and Nrf2−/− mice at 48 hpi for BrdU and K5 to examine proliferating mABSCs. (J) Quantification of mABSC proliferation in Wt and Nrf2−/− mouse repairing airway epithelium at 48 hpi. (K) Quantification of total cell numbers in Wt and Nrf2−/− mouse repairing airway epithelium at 48 hpi. Data shown as mean ± SEM, (n = 10), * P < 0.05, ** P < 0.01 and *** P < 0.001. See also Figure S4.
Figure 5
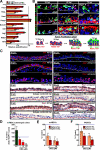
Figure 5. Notch Regulates ABSC Proliferation and is Downstream of Nrf2
(A) qPCR analysis for Notch pathway components in hABSCs transfected with Nrf2 siRNA or SCR siRNA. Data are represented relative to SCR siRNA transfected hABSCs, which is normalized to 1 (n=3). (B) Upper panel shows Notch (N) immunostaining pattern (nuclear) in polidocanol treated epithelium of Wt tracheas at 24, 48 and 72 hpi. Middle panel shows green arrowhead (K5+,Notch+,BrdU+ cells), orange arrowhead (K5+,Notch+,BrdU-cells), yellow arrowhead shows (K5-,Notch+,BrdU+ cells and likely represent EPs). Lower Panel shows green arrowhead (K8-,Notch+,BrdU+ cells and likely represent K5+ ABSCs), orange arrowhead (K8-,Notch+,BrdU-cells, likely represent non dividing K5+ cells), yellow arrowhead (K8+, Notch+, BrdU+ cells). (C) Sections of airway epithelium at 48 hpi as compared to uninjured airway immunostained with Notch pathway components; Dll1, Jag1, Hes1, Hey1 and HeyL respectively with isotype antibody controls. (D) Notch levels were modulated in mABSCs monolayer cultures by treating cells with DBZ or Notch1 constitutively activating plasmid (Nact). ABSC proliferation was determined by calculating the ratio of EdU + cells divided by the total number of cells (DAPI+) compared with control. (E) Mouse and human (F) ABSC tracheosphere cultures were treated with DBZ and the sphere number and sphere diameter measured. Data are presented as mean ± SEM; (n = 7), * P < 0.05, ** P < 0.01 and *** P < 0.01. See also Figure S5.
Figure 6
Figure 6. Notch Modulation Regulates ABSC Proliferation in vivo
(A) K5-NICD breeding scheme and experimental plan. (B-D) Representative IF images demonstrate differences in the repairing tracheas from the Wt uninjured, K5-NICD uninjured and treated with RU486, Wt (vehicle treated) 48 hpi, Wt DBZ treated 48 hpi and K5-NICD (with Ru486) 48 hpi. BrdU was examined for proliferation and acetylated β-tubulin, CC10 and PIgR were used as markers of differentiated cells. (E) and (F) Bar graphs representing the total cell counts and proliferating cells seen under the in vivo experimental conditions. Data are presented as mean ± SEM; (n = 7), * P < 0.05 and ** P < 0.01. See also Figure S6.
Figure 7
Figure 7. Nrf2 Directly Regulates Notch, which Activates ABSC Proliferation
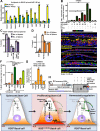
(A) qPCR from FACS sorted mABSCs of the repairing airway epithelium of Wt and Nrf2−/− mice at 48hpi for Notch pathway components compared to uninjured airway epithelium (dashed line) (n=13). (B) Dual luciferase assay to study the interaction between Nrf2 and Notch by CBL-Luc Notch reporter luciferase activity in ABSCs in the presence of DBZ, the Nrf2 activator SFN, and a constitutively active Notch plasmid (Nact) (n=6). (C) Adenoviral-Cre-GFP was transduced into FACS sorted Keap1fl/fl ABSCs. Keap1 deficient ABSCs were treated with DBZ and the number and size of the spheres was quantified. Dotted line represents Wt untreated control. (D) FACS sorted mABSCs isolated from the Wt, Nrf2−/−, K5-NICD and KNN mice were cultured in the sphere assay. The diameter and number of spheres were quantified from the brightfield images (Figure S7J). The dotted line represents Wt control. Data are presented as mean ± SEM;. (n = 3) . (E) IF for K5, K8 and BrdU of the repairing airway epithelium at 48 hpi in Wt, Nrf2−/−, K5-NICD, DBZ treated Wt and KNN mice. (F) Quantification of BrdU in the repairing airway epithelium in uninjured Wt, K5-NICD mice; Nrf2−/−, K5-NICD, DBZ treated Wt and KNN mice at 48 hpi. Data are presented as mean ± SEM; (n = 8). Significance was calculated by two-tailed, paired Student's t- test. Values are as mean ± SEM.* P < 0.05, ** P < 0.01 and *** P < 0.001. (G) mABSCs were transfected with two different known activating mutations of Nrf2 (Nrf2 V36 del [Nrf2a] and Nrf2 E821). Notch expression was measured using qPCR. Notch expression was measured relative to Wt untransfected ABSC control expression. Data are presented as mean ± SEM; (n = 3). (H) Cartoon showing the mouse Notch1 promoter and the ARE consensus sequences. The Notch ARE sequence used in the EMSA corresponds to ARE1, which is located between -204 and -196 bps upstream of the transcriptional start site. The Notch1 sequence used to generate probes for the EMSA is shown. The blue arrow shows the specific protein complex with the Notch1 probe, and the red arrowhead shows the super-shifted band after adding the Nrf2 antibody. (I) Schematic model of ROS flux tightly regulating ABSC self-renewal and repair after injury. ABSCs demonstrate heterogeneity with regard to ROS status. ROShi ABSCs are proliferation deficient and not shown. Quiescent ABSCs have a low level of ROS and after injury the ROSlo ABSCs undergo a flux change in their ROS levels to ROSmod. This flux activates Nrf2, which directly increases Notch1 expression and promotes self-renewal and proliferation for repair. Nrf2 also induces antioxidants that reduce ROS levels and this brings the ABSC back to the quiescent state with inhibition of proliferation in a tightly regulated fashion. See also Figure S7.

Similar articles

Cited by

References

    1. Barreiro E, Peinado VI, Galdiz JB, Ferrer E, Marin-Corral J, Sanchez F, Gea J, Barbera JA. Cigarette smoke-induced oxidative stress: A role in chronic obstructive pulmonary disease skeletal muscle dysfunction. American journal of respiratory and critical care medicine. 2010;182:477–488. - PubMed
    1. Blanpain C, Lowry WE, Pasolli HA, Fuchs E. Canonical notch signaling functions as a commitment switch in the epidermal lineage. Genes Dev. 2006;20:3022–3035. - PMC - PubMed
    1. Borthwick DW, Shahbazian M, Krantz QT, Dorin JR, Randell SH. Evidence for stem-cell niches in the tracheal epithelium. American journal of respiratory cell and molecular biology. 2001;24:662–670. - PubMed
    1. Chuikov S, Levi BP, Smith ML, Morrison SJ. Prdm16 promotes stem cell maintenance in multiple tissues, partly by regulating oxidative stress. Nature cell biology. 2010;12:999–1006. - PMC - PubMed
    1. DeNicola GM, Karreth FA, Humpton TJ, Gopinathan A, Wei C, Frese K, Mangal D, Yu KH, Yeo CJ, Calhoun ES, et al. Oncogene-induced Nrf2 transcription promotes ROS detoxification and tumorigenesis. Nature. 2011;475:106–109. - PMC - PubMed

Publication types

  NODES
admin 1
twitter 2