Expression of the mouse MHC class Ib H2-T11 gene product, a paralog of H2-T23 (Qa-1) with shared peptide-binding specificity
- PMID: 24958902
- PMCID: PMC4211609
- DOI: 10.4049/jimmunol.1302048
Expression of the mouse MHC class Ib H2-T11 gene product, a paralog of H2-T23 (Qa-1) with shared peptide-binding specificity
Abstract
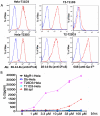
The mouse MHC class Ib gene H2-T11 is 95% identical at the DNA level to H2-T23, which encodes Qa-1, one of the most studied MHC class Ib molecules. H2-T11 mRNA was observed to be expressed widely in tissues of C57BL/6 mice, with the highest levels in thymus. To circumvent the availability of a specific mAb, cells were transduced with cDNA encoding T11 with a substituted α3 domain. Hybrid T11D3 protein was expressed at high levels similar to control T23D3 molecules on the surface of both TAP(+) and TAP(-) cells. Soluble T11D3 was generated by folding in vitro with Qa-1 determinant modifier, the dominant peptide presented by Qa-1. The circular dichroism spectrum of this protein was similar to that of other MHC class I molecules, and it was observed to bind labeled Qa-1 determinant modifier peptide with rapid kinetics. By contrast to the Qa-1 control, T11 tetramers did not react with cells expressing CD94/NKG2A, supporting the conclusion that T11 cannot replace Qa-1 as a ligand for NK cell inhibitory receptors. T11 also failed to substitute for Qa-1 in the presentation of insulin to a Qa-1-restricted T cell hybridoma. Despite divergent function, T11 was observed to share peptide-loading specificity with Qa-1. Direct analysis by tandem mass spectrometry of peptides eluted from T11D3 and T23D3 isolated from Hela cells demonstrated a diversity of peptides with a clear motif that was shared between the two molecules. Thus, T11 is a paralog of T23 encoding an MHC class Ib molecule that shares peptide-binding specificity with Qa-1 but differs in function.
Copyright © 2014 by The American Association of Immunologists, Inc.
Figures


Similar articles
-
The nonclassical MHC class I molecule Qa-1 forms unstable peptide complexes.J Immunol. 2004 Feb 1;172(3):1661-9. doi: 10.4049/jimmunol.172.3.1661. J Immunol. 2004. PMID: 14734748
-
Differential transcript profiles of MHC class Ib(Qa-1, Qa-2, and Qa-10) and Aire genes during the ontogeny of thymus and other tissues.J Immunol Res. 2014;2014:159247. doi: 10.1155/2014/159247. Epub 2014 Apr 16. J Immunol Res. 2014. PMID: 24829926 Free PMC article.
-
Constitutive and regulated expression of the class IB molecule Qa-1 in pancreatic beta cells.Immunology. 1998 May;94(1):64-71. doi: 10.1046/j.1365-2567.1998.00475.x. Immunology. 1998. PMID: 9708188 Free PMC article.
-
Comparative ability of Qdm/Qa-1b, kb, and Db to protect class Ilow cells from NK-mediated lysis in vivo.J Immunol. 2000 Dec 1;165(11):6142-7. doi: 10.4049/jimmunol.165.11.6142. J Immunol. 2000. PMID: 11086047
-
The specific regulation of immune responses by CD8+ T cells restricted by the MHC class Ib molecule, Qa-1.Annu Rev Immunol. 2000;18:185-216. doi: 10.1146/annurev.immunol.18.1.185. Annu Rev Immunol. 2000. PMID: 10837057 Review.
Cited by
-
What a Difference an Amino Acid Makes: An All-Atom Simulation Study of Nonameric Peptides in Inhibitory HLA-E/NKG2A/CD94 Immune Complexes.Front Pharmacol. 2022 Aug 4;13:925427. doi: 10.3389/fphar.2022.925427. eCollection 2022. Front Pharmacol. 2022. PMID: 35991867 Free PMC article.
-
Cryptic MHC-E epitope from influenza elicits a potent cytolytic T cell response.Nat Immunol. 2023 Nov;24(11):1933-1946. doi: 10.1038/s41590-023-01644-5. Epub 2023 Oct 12. Nat Immunol. 2023. PMID: 37828378
-
ERAAP Shapes the Peptidome Associated with Classical and Nonclassical MHC Class I Molecules.J Immunol. 2016 Aug 15;197(4):1035-43. doi: 10.4049/jimmunol.1500654. Epub 2016 Jul 1. J Immunol. 2016. PMID: 27371725 Free PMC article.
-
Protective Vaccination Reshapes Hepatic Response to Blood-Stage Malaria of Genes Preferentially Expressed by NK Cells.Vaccines (Basel). 2020 Nov 13;8(4):677. doi: 10.3390/vaccines8040677. Vaccines (Basel). 2020. PMID: 33202767 Free PMC article.
-
Crystal structure of Qa-1a with bound Qa-1 determinant modifier peptide.PLoS One. 2017 Aug 2;12(8):e0182296. doi: 10.1371/journal.pone.0182296. eCollection 2017. PLoS One. 2017. PMID: 28767728 Free PMC article.
References
-
- Jensen PE. Recent advances in antigen processing and presentation. Nat. Immunol. 2007;8:1041–1048. - PubMed
-
- Kumanovics A, Takada T, Lindahl KF. Genomic organization of the mammalian MHC. Annu. Rev. Immunol. 2003;21:629–657. - PubMed
-
- Howcroft T, Singer D. Expression of nonclassical MHC class Ib genes: comparison of regulatory elements. Immunol. Res. 2003;27:1–30. - PubMed
-
- Rodgers JR, Cook RG. MHC class Ib molecules bridge innate and acquired immunity. Nat. Rev. Immunol. 2005;5:459–471. - PubMed
-
- Shawar SM, Vyas JM, Rodgers JR, Rich RR. Antigen presentation by major histocompatibility complex class I-B molecules. Annu. Rev. Immunol. 1994;12:839–880. - PubMed
Publication types
MeSH terms
Substances
Grants and funding
LinkOut - more resources
Full Text Sources
Other Literature Sources
Molecular Biology Databases
Research Materials
Miscellaneous

