Co-delivery of doxorubicin and Bmi1 siRNA by folate receptor _targeted liposomes exhibits enhanced anti-tumor effects in vitro and in vivo
- PMID: 25285163
- PMCID: PMC4173760
- DOI: 10.7150/thno.9423
Co-delivery of doxorubicin and Bmi1 siRNA by folate receptor _targeted liposomes exhibits enhanced anti-tumor effects in vitro and in vivo
Abstract
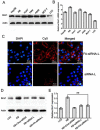
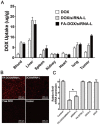
Bmi1 gene overexpression is found in various human tumors and has been shown as a potential _target for gene treatment. However, siRNA-based treatments _targeting Bmi1 gene have been restricted to limited delivery, low bioavailability and hence relatively reduced efficacy. To overcome these barriers, we developed a folate receptor _targeted co-delivery system folate-doxorubicin/Bmi1 siRNA liposome (FA-DOX/siRNA-L). The FA-DOX/siRNA-L was prepared through electrostatic interaction between folate doxorubicin liposome (FA-DOX-L) and Bmi1 siRNA. In vitro and in vivo studies showed that FA-DOX/siRNA-L inhibited tumor growth by combinatory role of Bmi1 siRNA and doxorubicin (DOX). Co-delivery of Bmi1 siRNA and DOX by FA-DOX/siRNA-L showed significantly higher efficacy than sole delivery of either DOX or Bmi1 siRNA. Real-time PCR and western blot analysis showed that FA-DOX/siRNA-L silenced the expression of Bmi1 gene. In addition, higher accumulation of the siRNA and DOX in tumor cells indicated that folate ligand displayed tumor _targeting effect. These results suggest that Bmi1 is an effective therapeutic _target for siRNA based cancer treatment that can be further improved by co-delivery of DOX through _targeted liposomes.
Keywords: Bmi1 siRNA; doxorubicin; folate receptor; liposome; tumor _targeting..
Conflict of interest statement
Competing Interests: The authors have declared that no competing interest exists.
Figures


Similar articles
-
Co-delivery of Bmi1 small interfering RNA with ursolic acid by folate receptor-_targeted cationic liposomes enhances anti-tumor activity of ursolic acid in vitro and in vivo.Drug Deliv. 2019 Dec;26(1):794-802. doi: 10.1080/10717544.2019.1645244. Drug Deliv. 2019. PMID: 31366257 Free PMC article.
-
Folate and TAT peptide co-modified liposomes exhibit receptor-dependent highly efficient intracellular transport of payload in vitro and in vivo.Pharm Res. 2014 Dec;31(12):3289-303. doi: 10.1007/s11095-014-1418-z. Epub 2014 May 24. Pharm Res. 2014. PMID: 24858397
-
A comparative study of folate receptor-_targeted doxorubicin delivery systems: dosing regimens and therapeutic index.J Control Release. 2015 Jun 28;208:106-20. doi: 10.1016/j.jconrel.2015.04.009. Epub 2015 Apr 11. J Control Release. 2015. PMID: 25869964
-
Overcoming doxorubicin resistance in cancer: siRNA-loaded nanoarchitectures for cancer gene therapy.Life Sci. 2022 Jun 1;298:120463. doi: 10.1016/j.lfs.2022.120463. Epub 2022 Mar 6. Life Sci. 2022. PMID: 35259354 Review.
-
Engineering a folic acid-decorated ultrasmall gemcitabine nanocarrier for breast cancer therapy: Dual _targeting of tumor cells and tumor-associated macrophages.Acta Pharm Sin B. 2022 Mar;12(3):1148-1162. doi: 10.1016/j.apsb.2021.09.024. Epub 2021 Sep 30. Acta Pharm Sin B. 2022. PMID: 35530140 Free PMC article. Review.
Cited by
-
A landscape of recent advances in lipid nanoparticles and their translational potential for the treatment of solid tumors.Bioeng Transl Med. 2023 Nov 9;9(2):e10601. doi: 10.1002/btm2.10601. eCollection 2024 Mar. Bioeng Transl Med. 2023. PMID: 38435821 Free PMC article. Review.
-
Folate-Equipped Cationic Liposomes Deliver Anti-MDR1-siRNA to the Tumor and Increase the Efficiency of Chemotherapy.Pharmaceutics. 2021 Aug 13;13(8):1252. doi: 10.3390/pharmaceutics13081252. Pharmaceutics. 2021. PMID: 34452213 Free PMC article.
-
Nanoparticles for _targeted delivery of therapeutics and small interfering RNAs in hepatocellular carcinoma.World J Gastroenterol. 2015 Nov 14;21(42):12022-41. doi: 10.3748/wjg.v21.i42.12022. World J Gastroenterol. 2015. PMID: 26576089 Free PMC article. Review.
-
Theranostic small interfering RNA nanoparticles in cancer precision nanomedicine.Wiley Interdiscip Rev Nanomed Nanobiotechnol. 2020 Mar;12(2):e1595. doi: 10.1002/wnan.1595. Epub 2019 Oct 23. Wiley Interdiscip Rev Nanomed Nanobiotechnol. 2020. PMID: 31642207 Free PMC article. Review.
-
Craft of Co-encapsulation in Nanomedicine: A Struggle To Achieve Synergy through Reciprocity.ACS Pharmacol Transl Sci. 2022 May 2;5(5):278-298. doi: 10.1021/acsptsci.2c00033. eCollection 2022 May 13. ACS Pharmacol Transl Sci. 2022. PMID: 35592431 Free PMC article. Review.
References
-
- Oh YK, Park TG. siRNA delivery systems for cancer treatment. Adv Drug Deliv Rev. 2009;61:850–62. doi:S0169-409X(09)00149-5 [pii] 10.1016/j.addr.2009.04.018. - PubMed
-
- Lobo NA, Shimono Y, Qian D, Clarke MF. The biology of cancer stem cells. Annual Review of Cell and Developmental Biology. 2007;23:675–99. doi:DOI 10.1146/annurev.cellbio.22.010305.104154. - PubMed
-
- Mihic-Probst D, Kuster A, Kilgus S, Bode-Lesniewska B, Ingold-Heppner B, Leung C. et al. Consistent expression of the stem cell renewal factor BMI-1 in primary and metastatic melanoma. International Journal of Cancer. 2007;121:1764–70. doi:Doi 10.1002/Ijc.22891. - PubMed
-
- Leung C, Lingbeek M, Shakhova O, Liu J, Tanger E, Saremaslani P. et al. Bmi1 is essential for cerebellar development and is overexpressed in human medulloblastomas. Nature. 2004;428:337–41. doi:Doi 10.1038/Nature02385. - PubMed
Publication types
MeSH terms
Substances
LinkOut - more resources
Full Text Sources
Other Literature Sources
Medical

