. 2014 Nov 10;42(20):12650-67.
doi: 10.1093/nar/gku915. Epub 2014 Oct 9.

Rad9 interacts with Aft1 to facilitate genome surveillance in fragile genomic sites under non-DNA damage-inducing conditions in S. cerevisiae

Affiliations

Rad9 interacts with Aft1 to facilitate genome surveillance in fragile genomic sites under non-DNA damage-inducing conditions in S. cerevisiae

Christos Andreadis et al. Nucleic Acids Res. .

Abstract

DNA damage response and repair proteins are centrally involved in genome maintenance pathways. Yet, little is known about their functional role under non-DNA damage-inducing conditions. Here we show that Rad9 checkpoint protein, known to mediate the damage signal from upstream to downstream essential kinases, interacts with Aft1 transcription factor in the budding yeast. Aft1 regulates iron homeostasis and is also involved in genome integrity having additional iron-independent functions. Using genome-wide expression and chromatin immunoprecipitation approaches, we found Rad9 to be recruited to 16% of the yeast genes, often related to cellular growth and metabolism, while affecting the transcription of ∼2% of the coding genome in the absence of exogenously induced DNA damage. Importantly, Rad9 is recruited to fragile genomic regions (transcriptionally active, GC rich, centromeres, meiotic recombination hotspots and retrotransposons) non-randomly and in an Aft1-dependent manner. Further analyses revealed substantial genome-wide parallels between Rad9 binding patterns to the genome and major activating histone marks, such as H3K36me, H3K79me and H3K4me. Thus, our findings suggest that Rad9 functions together with Aft1 on DNA damage-prone chromatin to facilitate genome surveillance, thereby ensuring rapid and effective response to possible DNA damage events.


Figures

Figure 1.
Figure 1.
Rad9 associates with Aft1 in vivo with its BRCT domain interacting with N-Aft1 in vitro.(A) In rad9Δ background, Aft1 was tagged with 9Myc epitopes. Rad9 tagged with flag epitope was inserted in the high copy plasmid pDB20 and this construct was inserted to rad9Δ strain in order to get rad9Δ Aft1–9Myc pDB20-Rad9-flag strain. rad9Δ Aft1–9Myc pDB20-flag strain was used as control. In SDS-PAGE and immunoblotting analysis, anti-Flag was used as a bait and probing was done with anti-Myc. Input and IP samples are shown. The co-IP experiment was repeated twice. (B) Protein extracts were prepared from wt cells grown in YPD/BPS-BCS, endogenously expressing Rad9–9Myc or Rad9–9Myc along with Aft1–3HA. Portions (1/40) of each extract (WCE) were analyzed by SDS-PAGE and immunoblotting using anti-HA or anti-Myc to detect Aft1–3HA and Rad9–9Myc, respectively. Remaining extracts were incubated with EZview anti-HA agarose beads and then flow-through (FT) as well as pulled-down (PD) proteins were analyzed by SDS-PAGE and immunoblotting using anti-Myc to detect Rad9–9Myc. (C) Bacterially expressed GST (negative control), GST-Nhp6a (positive control) (32), GST-N-Rad9 or GST-BRCT-Rad9 proteins, bound on glutathione agarose beads, were incubated with bacterially expressed 6xHis-N-Aft1 or 6xHis-C-Aft1 derivatives eluted from Ni-NTA agarose beads. Glutathione beads were then washed and proteins bound on them were analysed by SDS-PAGE and immunoblotting using anti-His antibody. The input lane contains 20% of the total amount of each 6xHis-tagged protein incubated with the beads. Left panel: coomassie blue gel showing the electrophoretic pattern of the GST-tagged (total amounts) as well as the 6xHis-tagged (input amounts) proteins used in the assay.
Figure 2.
Figure 2.
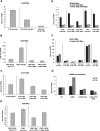
Rad9 is recruited to Aft1-regulated genes in an Aft1-dependent manner. By ChIP analysis the enrichment of Rad9–9Myc was studied in each amplicon (x-axis): on FTR1(A), on FRE1(B), on CTR1(C) and on FRE7 gene (D). The enrichment of Rad9–9Myc on CTR1 and FTR1 promoter and coding regions as obtained by ChIP analyses in Rad9–9Myc, aft1Δ Rad9–9Myc and aft1Δaft2Δ Rad9–9Myc strains is visualized in (E). Aft2 is an Aft1 paralogue protein, with partially redundant function (40,41). The Aft1–9Myc enrichment on CTR1 and FTR1 promoter and coding regions as obtained by ChIP analyses in Aft1–9Myc and rad9Δ Aft1–9Myc is visualized in (F). All strains were grown under induction conditions (see text). Normalization in all cases was performed firstly over INPUT chromatin and secondly by measuring the enrichment of Rad9–9Myc on PHO5 coding region, where Rad9–9Myc binding is minimal in such growth conditions (as tested by our group) and dividing Rad9–9Myc enrichment to this ‘non-specific’ enrichment. A dotted line in the ChIP experiments distinguishes the enrichment in the gene promoter from the enrichment in the coding regions. (G) RNA was isolated from strains (x-axis) grown under induction conditions and RT assay combined with qPCR was performed, aiming to assess changes in the CTR1 and FTR1 transcript levels. Normalization was done over change of CMD1 expression (not altered in these growth conditions), after firstly normalizing over the wt strain. The experiment was performed three times.
Figure 3.
Figure 3.
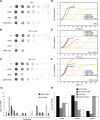
Rad9 and Aft1 exhibit synthetic effect and may affect transcriptional elongation. Cultures of the strains were grown in rich medium (YPD) to an OD600 = 1.0. Seven serial dilutions of the cells were spotted (A) on YPD plates, (B) on YPD plates which contained 300 μg/ml 6-AU and (C) on YPD plates which contained 50 μM FeCl3. Plates were incubated for 2 days at 30°C. Microscopy studies showed that the examined mutants have similar cell size in YPD rich medium (data not shown). The OD600 of exponentially growing cells (starting from an OD600 = 0.25) was measured every 20 min (D) inYPD, (E) in YPD plus 300 μg/ml 6-AU and (F) in YPD plus 50 μM FeCl3, until they reached stationary phase, using the BioLector technology. Values of each growth curve were normalized over the value of the first measurement in each case (wt, rad9Δ, aft1Δ, rad9Δaft1Δ). The relative growth rate of the strains in each condition was calculated and the values are shown in parentheses. (G) ChIP analysis that shows Rad9–13Myc and Aft1–9Myc enrichment to yeast centromeres. Normalization was performed firstly over INPUT chromatin and secondly by measuring the binding of Rad9–13Myc on FRE2 coding region (where Rad9 and Aft1 binding is minimal in the used growth conditions) and then dividing Rad9–13Myc or Aft1–9Myc enrichment by this ‘non-specific’ enrichment. Experiments were performed at least in duplicate. The same binding pattern was also obtained after normalizing over PHO5 coding region with similar results (data not shown). Due to high content in AT nucleotides in centromeric areas, some of the primers were not functional in real-time PCR (chr IX and XI). (H) Aft1-dependency of Rad9 localization to centromeres. The centromeric localization of Rad9–13Myc in wt and aft1Δ cells, as well as the centromeric localization of Aft1–9Myc in wt and rad9Δ cells was examined by ChIP in CENIII, CENXII and CENXV. All strains were grown under inducing conditions (SC BCS BPS). Normalization was performed firstly over INPUT chromatin and secondly by measuring the enrichment of Rad9–13Myc on PHO5, as described in the legend to Figure 2.
Figure 4.
Figure 4.
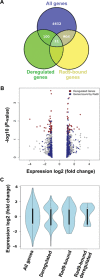
Expression analyses of rad9Δ cells and correlation to Rad9 localization. (A) Venn diagram representing total number of genes and overlaps with deregulated and Rad9-bound genes. Overlap between Rad9-bound and deregulated genes was significant on the basis of a Fischer's test (P-value < 0.01). (B) Volcano plot for a genome-wide expression profile of rad9Δ cells. All genes depicted in grey. Significantly deregulated genes (P < 0.05) depicted in red and Rad9 bound genes in blue. Note the ‘loading’ of the blue dots to the right side of the plot (upregulation). (C) ‘Violin-shaped’ boxplots summarizing the distribution of log2 (Fold-change) expression values for all genes, deregulated ones (131 genes with P < 0.05), Rad9 bound genes (935) and the interesection of Rad9 bound and deregulated genes (31 genes, see also Venn diagram). The shift towards upregulation is noted as a trend for the total Rad9-bound genes and becomes significant between the ‘Deregulated’ and ‘Rad9-bound deregulated’ gene sets (one-sided t-test P-value < 0.05).
Figure 5.
Figure 5.
Genome-wide localization of Rad9 in the presence and absence of Aft1. (A) Partition of ChiP peaks into coding and non-coding chromatin for: Rad9–13Myc, Aft1–9Myc, common sites, rad9Δ Aft1–9Myc and aft1Δ Rad9–13Myc compared to the background partition for the complete yeast genome. A clear enrichment in coding sequences is especially notable for the common sites (Rad9–13Myc+Aft1–9Myc). All coding ratios except of rad9Δ Aft1–9Myc have a value of 0.79 or more compared to a genome average of 0.71. Bootstrap P-values of enrichment were calculated using 106 random permutations of the binding sites. All P-values were <10−6 except from rad9Δ Aft1–9Myc which showed a partition similar to the genome background. (B) Rad9–13Myc is localized to the most active yeast genes in an Aft1-dependent manner. Yeast genes were grouped in six equal groups (x-axis) in descending transcriptional activity in SC BCS BPS growth conditions (our microarray data). Rad9 _targets (ChIP peaks significant to a P < 0.005 level) that fell within each group were calculated (y-axis) in wt or aft1Δ cells (red and blue lines, respectively). Distribution of common _targets of Rad9 and Aft1 is also shown. His3–9Myc control protein is shown in grey. (C) The same analysis as in (B) was performed for Aft1–9Myc in wt or rad9Δ cells (dark and light purple lines, respectively) following curves with similar slopes. (D) Rad9–13Myc has a binding bias for long genes. S. cerevisiae genes were grouped in 20 bins depending on their size (x-axis). The percentage of the number of ChIP peaks from each experiment that fit each of the bins is plotted. The distribution of all yeast Open Reading Frames (ORFs) is plotted in grey line.
Figure 6.
Figure 6.
Average gene relative occupancy of Rad9 and Aft1 and localization patterns to methylated _targets. Average gene analysis was performed to the genome-wide localization data as described in Materials and Methods. Relative occupancies of (A) Rad9–13Myc in SC BCS BPS, (B)aft1Δ Rad9–13Myc in SC BCS BPS, (C) Aft1–9Myc in SC BCS BPS and (D)rad9Δ Aft1–9Myc in SC BCS BPS are shown. (E–G) Rad9 and Aft1 ChIP localization signal on methylated _targets. Three methylated genes according to Pokholok et al. study (36) were randomly selected. The average binding profiles of Rad9, aft1Δ Rad9, Aft1 and rad9Δ Aft1 on those genes are presented: (E) PGI1, (F) FBA1, (G) MET6. Binding patterns are representative of the genome-wide profiles. Note the direction of the transcription on the genes (right to left).
Figure 7.
Figure 7.
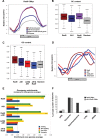
Rad9 localizes to GC-rich regions and meiotic recombination hotspots in an Aft1-dependent manner. (A) Rad9–13Myc ChIP signal mean patterns for genes bound by Rad9, Aft1 and by both proteins compared to the average for the total number of yeast genes. (B) GC content boxplots of genes bound by Rad9, Aft1 or both proteins in comparison to the complete set of genes in full correspondence with (A). Rad9-bound genes show the highest GC content. (C) GC content boxplots of binding sites (enriched loci) for Rad9 and Aft1, in the presence or absence of each other, compared to a set of randomly selected genomic positions. Rad9 sites also show the highest GC content, which is significantly lowered in the absence of Aft1. The same effect is observed for Aft1 in the absence of Rad9. (D) Mean binding patterns for Rad9 and Aft1 both in the presence and absence of each other (combined plot of Figure 6A–D). (E) Occupancy enrichment values for coding regions, non-coding spacers (see Figure 5A), hot ORFs and hotspots, expressed as the ratio of observed over expected occupancy based on the genome average. Significant (more than 2-fold) enrichment in Rad9, Aft1 and common binding sites was observed for both hot ORFs and hotspots while significant depletion was calculated for Rad9 sites in the absence of Aft1 and to a lesser extent for Aft1 sites in the absence of Rad9. Bootstrap values calculated for 106 random permutations. (***P < 10−6; **P < 10−4; *P < 10−3, n.s.=non-significant). (F) The five non-ORF feature categories that were most represented in Rad9–13Myc Tiling Arrays in the presence or absence of Aft1 (black and grey columns, respectively) are presented in the chart, as percentage of the total number of features in each category in the yeast genome.
Figure 8.
Figure 8.
Model for the potential surveillance of DNA damage-prone chromatin by Rad9 and Aft1. Highly active, GC-rich and prone to DNA damage genomic regions are depicted in red rectangles, while non-active correspond to regions in grey. (1) Under non-DNA damage-inducing conditions, Rad9 (in dark yellow) interacts via its BRCT domain (asterisks) with Aft1 (in blue) N-terminal part. Rad9 is recruited to DNA damage-prone chromatin along with Aft1 in an Aft1-dependent manner. It is possible that when a DNA damage event occurs, Aft1 transcription factor could recruit other cofactors. (2) The protein complex at the DNA damage site could facilitate the access of the DNA repair machinery (in light blue), while Rad9 (and possibly more proteins participating in the DDR cascade) are already on the site. (3) The whole DNA repair machinery is recruited to the DNA damage site, ensuring a rapid response to DNA damage leading to an effective repair of the impaired chromatin.

Similar articles

Cited by

References

    1. Kerzendorfer C., O'Driscoll M. Human DNA damage response and repair deficiency syndromes: linking genomic instability and cell cycle checkpoint proficiency. DNA Repair (Amst) 2009;8:1139–1152. - PubMed
    1. Weinert T.A., Hartwell L.H. The RAD9 gene controls the cell cycle response to DNA damage in Saccharomyces cerevisiae. Science. 1988;241:317–322. - PubMed
    1. Soulier J., Lowndes N.F. The BRCT domain of the S. cerevisiae checkpoint protein Rad9 mediates a Rad9-Rad9 interaction after DNA damage. Curr. Biol. 1999;9:551–554. - PubMed
    1. Hammet A., Magill C., Heierhorst J., Jackson S.P. Rad9 BRCT domain interaction with phosphorylated H2AX regulates the G1 checkpoint in budding yeast. EMBO Rep. 2007;8:851–857. - PMC - PubMed
    1. Nnakwe C.C., Altaf M., Cote J., Kron S.J. Dissection of Rad9 BRCT domain function in the mitotic checkpoint response to telomere uncapping. DNA Repair (Amst) 2009;8:1452–1461. - PMC - PubMed

Publication types

MeSH terms

  NODES
Association 1
innovation 1
Note 3
twitter 2