. 2014 Dec 18;5(12):e1576.
doi: 10.1038/cddis.2014.530.

Resveratrol regulates mitochondrial reactive oxygen species homeostasis through Sirt3 signaling pathway in human vascular endothelial cells

Affiliations

Resveratrol regulates mitochondrial reactive oxygen species homeostasis through Sirt3 signaling pathway in human vascular endothelial cells

X Zhou et al. Cell Death Dis. .

Abstract

Mitochondrial reactive oxygen species (mtROS) homeostasis plays an essential role in preventing oxidative injury in endothelial cells, an initial step in atherogenesis. Resveratrol (RSV) possesses a variety of cardioprotective activities, however, little is known regarding the effects of RSV on mtROS homeostasis in endothelial cells. Sirt3 is a mitochondrial deacetylase, which plays a key role in mitochondrial bioenergetics and is closely associated with oxidative stress. The goal of the study is to investigate whether RSV could attenuate oxidative injury in endothelial cells via mtROS homeostasis regulation through Sirt3 signaling pathway. We found that pretreatment with RSV suppressed tert-butyl hydroperoxide (t-BHP)-induced oxidative damage in human umbilical vein endothelial cells (HUVECs) by increasing cell viability, inhibiting cell apoptosis, repressing collapse of mitochondrial membrane potential and decreasing mtROS generation. Moreover, the enzymatic activities of isocitrate dehydrogenase 2 (IDH2), glutathione peroxidase (GSH-Px) and manganese superoxide dismutase (SOD2) as well as deacetylation of SOD2 were increased by RSV pretreatment, suggesting RSV notably enhanced mtROS scavenging in t-BHP-induced endothelial cells. Meanwhile, RSV remarkably reduced mtROS generation by promoting Sirt3 enrichment within the mitochondria and subsequent upregulation of forkhead box O3A (FoxO3A)-mediated mitochondria-encoded gene expression of ATP6, CO1, Cytb, ND2 and ND5, thereby leading to increased complex I activity and ATP synthesis. Furthermore, RSV activated the expressions of phosphorylated adenosine monophosphate-activated protein kinase (p-AMPK), peroxisome proliferator-activated receptor gamma coactivator-1α (PGC-1α) and Sirt3, as well as estrogen-related receptor-α (ERRα)-dependent Sirt3 mRNA transcription, which were abolished in the presence of AMPK inhibitor and AMPK, PGC-1α or Sirt3 siRNA transfection, indicating the effects of RSV on mtROS homeostasis regulation were dependent on AMPK-PGC-1α-ERRα-Sirt3 signaling pathway. Our findings indicated a novel mechanism that RSV-attenuated oxidative injury in endothelial cells through the regulation of mtROS homeostasis, which, in part, was mediated through the activation of the Sirt3 signaling pathway.


Figures

Figure 1
Figure 1
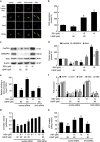
RSV inhibited t-BHP-induced injury in HUVECs. (a and b) Cells were treated with t-BHP with different concentrations (20, 30, 40, 50, 60, 70, 80, 90 and 100 μM) for 4 h (a) or for different time intervals (1, 2, 4, 8, 12 and 24 h; b), respectively. Cell viability was determined using the CCK-8 assay and data are expressed as percentage of the control. (c) Confluent cells were pretreated for 2 h with various concentrations of RSV (0.1, 0.5, 1, 5, 10 and 15 μM). After removing the supernatants, cells were incubated with fresh medium in the presence or absence of t-BHP (80 μM) for an additional 4 h. Cell viability was determined using the CCK-8 assay. (d) Representative images of flow cytometric analysis by annexin V-FITC/PI dual staining. The bottom right quadrant represents annexin V-FITC-stained cells (early-phase apoptotic cells) and the top right quadrant represents PI- and annexin V-FITC-dual-stained cells (late-phase apoptotic/necrotic cells). (e) Apoptotic cells are represented as the percentage of annexin-V single-positive plus annexin-V/PI double-positive cells. (f) After the indicated treatments, the cells were harvested and lysed to detect the cytoplasmic and mitochondrial levels of Bax and Bcl-2 by western blot analysis. (g) The bar graphs show the ratio of Bax/Bcl-2 in the cytosolic fraction in endothelial cells. (h) The bar graphs show the ratio of Bax/Bcl-2 in the mitochondrial fraction in endothelial cells. (i) The expressions of AIF and CytC in the cytosolic fraction of endothelial cells were detected. (j) The bar graphs show the quantification of the indicated proteins. All results are representative of three independent experiments and values are presented as means±S.E.M. (n=3). aP<0.05, bP<0.01 versus the control group; cP<0.05, dP<0.01 versus the t-BHP-treated group
Figure 2
Figure 2
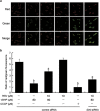
RSV suppressed t-BHP-induced collapse of mitochondrial membrane potential in HUVECs. Sirt3 was knocked down by Sirt3 siRNA transfection as described in the Materials and Methods section. At 24-h post-transfection, cells were pretreated with RSV of 10 μM for 2 h, washed, and then treated with or without t-BHP of 80 μM for an additional 4 h. (a) Determination of Δψm was carried out using CLSM. Red fluorescence was emitted by JC-1 aggregates in healthy mitochondria with polarized inner mitochondrial membranes, whereas green fluorescence was emitted by cytosolic JC-1 monomers, indicating Δψm dissipation. Merged images indicate co-localization of JC-1 aggregates and monomers. (b) Δψm in each group was calculated as the ratio of red to green fluorescence. All results are presented as mean±S.E.M. of at least three independent experiments. bP<0.01 versus the control group; dP<0.01 versus the t-BHP-treated group; eP<0.05 versus RSV (10 μM) and t-BHP (80 μM) co-treated group with control siRNA transfection
Figure 3
Figure 3
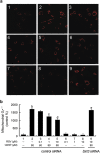
RSV attenuated t-BHP-induced mitochondrial dysfunction by inhibiting mtROS generation in HUVECs. Cells were transfected with Sirt3 siRNA as described in the Materials and Methods section. At 24-h post-transfection, cells were pretreated with RSV (0.1, 1 and 10 μM) for 2 h, washed, and then incubated with fresh medium in the presence or absence of t-BHP (80 μM) for an additional 4 h. (a) The mitochondrial O2•− levels were estimated using MitoSOX Red and the fluorescence values were read at an excitation wavelength of 510 nm and emission wavelength of 579 nm. (b) The bar charts show quantification of the mitochondrial O2•− levels expressed as the fold change relative to the control group. All results are presented as means±S.E.M. of at least three independent experiments. bP<0.01 versus the control group; cP<0.05, dP<0.01 versus the t-BHP-treated group; eP<0.05 versus RSV (10 μM) and t-BHP (80 μM) co-treated group with control siRNA transfection
Figure 4
Figure 4
RSV reduced mtROS generation by stimulating Sirt3-mediated mitochondrial enzyme activities and SOD2 deacetylation. Cells were transfected with Sirt3 siRNA as described in the Materials and Methods section. At 24-h post-transfection, cells were pretreated with different concentrations of RSV (0.1, 1 and 10 μM) for 2 h and then treated with or without t-BHP of 80 μM for an additional 4 h. (ac) The enzyme activities of IDH2 (a), GSH-Px (b) and SOD2 (c) were determined using the corresponding assay kits, according to the manufacturer's instructions. (d) After the indicated treatments, the cells were harvested and lysed to detect protein levels of ac-SOD2 by western blot analysis. All results are presented as means±S.E.M. of at least three independent experiments. aP<0.05, bP<0.01 versus the control group; cP<0.05, dP<0.01 versus the t-BHP-treated group; eP<0.05, fP<0.01 versus RSV (10 μM) and t-BHP (80 μM) co-treated group with control siRNA transfection
Figure 5
Figure 5
RSV reduced mtROS generation through the promotion of Sirt3-mediated mtDNA transcription. Cells were pretreated by RSV (10 μM) for 2 h, then washed, and followed by treatment with or without t-BHP (80 μM) for an additional 4 h. (a) Representative images show Sirt3 expression within mitochondria in HUVECs by immuofluorescence assay. Red fluorescence indicates mitochondria labeled with Mito-tracker Red. Green fluorescence originates from anti-Sirt3 labeling. And blue fluorescence indicates nuclei stained with DAPI. (b) The bar graph shows quantification of Sirt3 expression in the mitochondria. (c) The expressions of mtRNAPol, FoxO3A and Sirt3 in the mitochondria were determined by western blot. (d) The bar graph shows quantification of the indicated proteins. Sirt3 was knocked down by Sirt3 siRNA transfection as described in the Materials and Methods section. The cells were pretreated with RSV of 10 μM for 2 h, then washed, and followed by incubation with fresh medium in the presence or absence of t-BHP of 80 μM for an additional 4 h. (e) Cells were harvested for ChIP analysis and the recruitment of FoxO3A was measured by real-time PCR assay using primers _targeted to Sirt3. The results were plotted relative to those of the total input controls (untreated chromatin). (f) The expressions of mtDNA-encoded genes of ATP6, CO1, Cytb, ND2 and ND5 along with the housekeeping genes of β-actin, GAPDH and 18s rRNA were determined by real-time PCR assay. In order to generate a relative expression ratio, the expressions of the genes of interest were normalized to the geometric average of the housekeeping genes. (g) The enzyme activity of complex I was determined using the corresponding assay kit, according to the manufacturer's instructions. (h) ATP content was determined using an ATP determination kit. All results are presented as means±S.E.M. of at least three independent experiments. aP<0.05, bP<0.01 versus the control group; cP<0.05, dP<0.01 versus the t-BHP-treated group; eP<0.05, fP<0.01 versus RSV (10 μM) and t-BHP (80 μM) co-treated group with control siRNA transfection
Figure 6
Figure 6
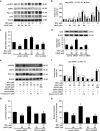
RSV stimulated AMPK-PGC-1α-ERRα-Sirt3 signaling pathway in HUVECs. (a) Cells were pretreated with RSV (0.1, 1 and 10 μM) for 2 h and then treated with or without t-BHP of 80 μM for an additional 4 h. The cells were harvested and lysed to detect protein levels of AMPK, p-AMPK, PGC-1α and Sirt3 by western blot assay. (b) The bar charts show quantification of the indicated proteins. Cells were transfected with PGC-1α siRNA as described in the Materials and Methods section. (c) The mRNA levels of the Sirt3 genes were determined by real-time PCR assay. (d) The cells were collected and lysed, and Sirt3 protein levels were detected by western blot analysis. Cells were preincubated with compound C (10 μM), AMPK siRNA or AICAR (500 μM) as described in the Materials and Methods section. Then cells were pretreated with RSV of 10 μM for 2 h, followed by incubation in the presence or absence of t-BHP of 80 μM for an additional 4 h. (e) The expressions of AMPK, p-AMPK and PGC-1α were measured by western blot. (f) The bar charts show quantification of the indicated proteins. Cells were transfencted with PGC-1α siRNA as described in the Materials and Methods section. At 24-h post-transfection, the cells were pretreated with RSV of 10 μM for 2 h and then treated with or without t-BHP of 80 μM for an additional 4 h. (g) Cells were harvested using ChIP assay, and real-time PCR assay was carried out using primers specific to the Sirt3 promoter. The results were determined relative to those of the total input controls (untreated chromatin). (h) Cells were co-transfected with pRL-TK reporter plasmid supplemented with ERRE-luc or NEG-PG04 (vehicle control), respectively. ERRα was knocked down by ERRα siRNA transfection, as described in the Materials and Methods section. And then cells were pretreated with RSV of 10 μM for 2 h, followed by treatment with or without t-BHP of 80 μM for an additional 4 h. Both firefly and Renilla luciferase activities were measured sequentially using the Dual-Glo luciferase reporter assay system. All results are presented as means±S.E.M. of at least three independent experiments. aP<0.05, bP<0.01 versus the control group; cP<0.05, dP<0.01 versus t-BHP-treated group; eP<0.05, fP<0.01 versus RSV (10 μM) and t-BHP (80 μM) co-treated group with control siRNA transfection
Figure 7
Figure 7
Proposed mechanism for RSV in the regulation of mtROS homeostasis through Sirt3 signaling pathway in HUVECs. RSV triggers AMPK-PGC-1α signaling pathway, which is required for ERRα-dependent Sirt3 transcription and subsequent enrichment within the mitochondria, thereby leading to deacetylation and activation of mitochondrial enzymes involved in mtROS regulation as well as stimulation of mitochondrial ETC efficiency by upregulation of mtDNA-encoded gene expression and ATP synthesis, finally contributing to mtROS homeostasis in HUVECs. I, complex I; II, complex II; III, complex III; IV, complex IV; V, ATP synthase enzymes; Q, CoQ; Cytc, cytochrome c

Similar articles

Cited by

References

    1. 1Goldschmidt-Clermont PJ, Dong C, Seo DM, Velazquez OC. Atherosclerosis, inflammation, genetics, and stem cells: 2012 update. Curr Atheroscler Rep 2012; 14: 201–210. - PMC - PubMed
    1. 2Forstermann U. Oxidative stress in vascular disease: causes, defense mechanisms and potential therapies. Nat Clin Pract Cardiovasc Med 2008; 5: 338–349. - PubMed
    1. 3Jang C, Arany Z. Metabolism: sweet enticements to move. Nature 2013; 500: 409–411. - PMC - PubMed
    1. 4Dromparis P, Michelakis ED. Mitochondria in vascular health and disease. Annu Rev Physiol 2013; 75: 95–126. - PubMed
    1. 5Kluge MA, Fetterman JL, Vita JA. Mitochondria and endothelial function. Circ Res 2013; 112: 1171–1188. - PMC - PubMed

Publication types

MeSH terms

  NODES
twitter 2