Analytical evaluation of the Diazyme glycated serum protein assay on the siemens ADVIA 1800: comparison of results against HbA1c for diagnosis and management of diabetes
- PMID: 25591854
- PMCID: PMC4604597
- DOI: 10.1177/1932296814567894
Analytical evaluation of the Diazyme glycated serum protein assay on the siemens ADVIA 1800: comparison of results against HbA1c for diagnosis and management of diabetes
Abstract
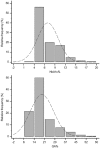
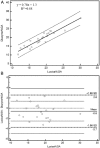
Hemoglobin A1c (HbA1c) is considered the gold standard for assessment of glycemic control in diabetic patients. HbA1c is inadequate in individuals homozygous or compound heterozygous for hemoglobin variants or in conditions with an altered red blood cell turnover. In these cases glycated albumin (GA) is proposed as an alternative assay. We aimed to evaluate the analytical performance of the Diazyme glycated serum protein (GSP) assay on an automated analyzer, to establish a reference interval (RI), and to compare from a clinical perspective, GSP/GA with glycated Hb (glyHb) results. Validation studies followed the CLSI guidelines and included precision, linearity, interferences, concordance of results with glyHb, and RI calculation. GSP was analyzed on representative samples with previously ordered HbA1c and albumin from the Dyna LIFE : DX laboratory. Samples from patients with bisalbuminemia, hemoglobinopathies, and multiple myeloma were also included. Within-run and total imprecision was <3.0% at both levels of control, analytical sensitivity was 5.31 μmol/L, and linearity was verified from 10 to 1150 μmol/L (total allowable error of 5%). Clinical concordance between %GA and glyHb was substantial (n = 175, R2 = .91, kappa = .78, P = .167). GSP RI was 160 to 340 μmol/L or if expressed as %GA 10.5 to 17.5%. Analytical performance of the Diazyme GSP assay on the Siemens ADVIA 1800 is acceptable for clinical use. The RI obtained was higher than that suggested by the manufacturer.
Keywords: diabetes mellitus; glycated albumin; glycated hemoglobin; glycated protein; glycemic markers; hemoglobin A1c.
© 2015 Diabetes Technology Society.
Conflict of interest statement
Figures


Similar articles
-
Comparative study on hemoglobin A1c, glycated albumin and glycosylated serum protein in aplastic anemia patients with Type 2 diabetes mellitus.Biosci Rep. 2020 May 29;40(5):BSR20192300. doi: 10.1042/BSR20192300. Biosci Rep. 2020. PMID: 32352504 Free PMC article.
-
Comparison of Glycemic Markers in Chronic Hemodialysis Using Continuous Glucose Monitoring.Am J Nephrol. 2018;47(1):21-29. doi: 10.1159/000485843. Epub 2017 Dec 22. Am J Nephrol. 2018. PMID: 29275415
-
Analytical Performance of Two Enzymatic Methods for Glycated Albumin.Clin Lab. 2020 Oct 1;66(10). doi: 10.7754/Clin.Lab.2020.200213. Clin Lab. 2020. PMID: 33073960
-
[Indicators of glycemic control --hemoglobin A1c (HbA1c), glycated albumin (GA), and 1,5-anhydroglucitol (1,5-AG)].Rinsho Byori. 2014 Jan;62(1):45-52. Rinsho Byori. 2014. PMID: 24724426 Review. Japanese.
-
The clinical usefulness of glycated albumin in patients with diabetes and chronic kidney disease: Progress and challenges.J Diabetes Complications. 2018 Sep;32(9):876-884. doi: 10.1016/j.jdiacomp.2018.07.004. Epub 2018 Jul 11. J Diabetes Complications. 2018. PMID: 30049445 Review.
Cited by
-
Glycated albumin as a biomarker for diagnosis of diabetes mellitus: A systematic review and meta-analysis.World J Clin Cases. 2021 Nov 6;9(31):9520-9534. doi: 10.12998/wjcc.v9.i31.9520. World J Clin Cases. 2021. PMID: 34877286 Free PMC article.
-
Glycated albumin: from biochemistry and laboratory medicine to clinical practice.Endocrine. 2017 Mar;55(3):682-690. doi: 10.1007/s12020-016-1091-6. Epub 2016 Sep 13. Endocrine. 2017. PMID: 27623968 Review.
-
D-ribose metabolic disorder and diabetes mellitus.Mol Biol Rep. 2024 Jan 28;51(1):220. doi: 10.1007/s11033-023-09076-y. Mol Biol Rep. 2024. PMID: 38281218 Free PMC article. Review.
-
Haemoglobin A1c or Glycated Albumin for Diagnosis and Monitoring Diabetes: An African Perspective.Indian J Clin Biochem. 2018 Jul;33(3):255-261. doi: 10.1007/s12291-018-0755-9. Epub 2018 May 3. Indian J Clin Biochem. 2018. PMID: 30072824 Free PMC article. Review.
-
Diagnostic value of glycemic markers HbA1c, 1,5-anhydroglucitol and glycated albumin in evaluating gestational diabetes mellitus.Ther Adv Endocrinol Metab. 2017 Dec;8(12):161-167. doi: 10.1177/2042018817742580. Epub 2017 Nov 23. Ther Adv Endocrinol Metab. 2017. PMID: 29238514 Free PMC article.
References
-
- Bry L, Chen PC, Sacks DB. Effects of hemoglobin variants and chemically modified derivatives on assays for glycohemoglobin. Clin Chem. 2001;47:153-163. - PubMed
-
- Koga M, Hashimoto K, Murai J, et al. Usefulness of glycated albumin as an indicator of glycemic control status in patients with hemolytic anemia. Clin Chim Acta. 2011;412:253-257. - PubMed
-
- Little RR, Rohlfing CL, Hanson S, et al. Effects of hemoglobin (hb) e and hbd traits on measurements of glycated hb (HbA1c) by 23 methods. Clin Chem. 2008;54:1277-1282. - PubMed
Publication types
MeSH terms
Substances
LinkOut - more resources
Full Text Sources
Other Literature Sources
Medical

