Synergic chemoprevention with dietary carbohydrate restriction and supplementation of AMPK-activating phytochemicals: the role of SIRT1
- PMID: 25747515
- PMCID: PMC4885538
- DOI: 10.1097/CEJ.0000000000000141
Synergic chemoprevention with dietary carbohydrate restriction and supplementation of AMPK-activating phytochemicals: the role of SIRT1
Abstract
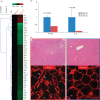
Calorie restriction or a low-carbohydrate diet (LCD) can increase life span in normal cells while inhibiting carcinogenesis. Various phytochemicals also have calorie restriction-mimetic anticancer properties. We investigated whether an isocaloric carbohydrate-restriction diet and AMP-activated protein kinase (AMPK)-activating phytochemicals induce synergic tumor suppression. We used a mixture of AMPK-activating phytochemical extracts including curcumin, quercetin, catechins, and resveratrol. Survival analysis was carried out in a B16F10 melanoma model fed a control diet (62.14% kcal carbohydrate, 24.65% kcal protein and 13.2% kcal fat), a control diet with multiple phytochemicals (MP), LCD (16.5, 55.2, and 28.3% kcal, respectively), LCD with multiple phytochemicals (LCDmp), a moderate-carbohydrate diet (MCD, 31.9, 62.4, and 5.7% kcal, respectively), or MCD with phytochemicals (MCDmp). Compared with the control group, MP, LCD, or MCD intervention did not produce survival benefit, but LCDmp (22.80±1.58 vs. 28.00±1.64 days, P=0.040) and MCDmp (23.80±1.08 vs. 30.13±2.29 days, P=0.008) increased the median survival time significantly. Suppression of the IGF-1R/PI3K/Akt/mTOR signaling, activation of the AMPK/SIRT1/LKB1pathway, and NF-κB suppression were the critical tumor-suppression mechanisms. In addition, SIRT1 suppressed proliferation of the B16F10 and A375SM cells under a low-glucose condition. Alterations in histone methylation within Pten and FoxO3a were observed after the MCDmp intervention. In the transgenic liver cancer model developed by hydrodynamic transfection of the HrasG12V and shp53, MCDmp and LCDmp interventions induced significant cancer-prevention effects. Microarray analysis showed that PPARα increased with decreased IL-6 and NF-κB within the hepatocytes after an MCDmp intervention. In conclusion, an isocaloric carbohydrate-restriction diet and natural AMPK-activating agents induce synergistic anticancer effects. SIRT1 acts as a tumor suppressor under a low-glucose condition.
Figures


Comment in
-
AMP-activated protein kinase activators, cancer regression, and survival.Eur J Cancer Prev. 2016 May;25(3):252-3. doi: 10.1097/CEJ.0000000000000170. Eur J Cancer Prev. 2016. PMID: 25932871 No abstract available.
Similar articles
-
Resveratrol modulates tumor cell proliferation and protein translation via SIRT1-dependent AMPK activation.J Agric Food Chem. 2010 Feb 10;58(3):1584-92. doi: 10.1021/jf9035782. J Agric Food Chem. 2010. PMID: 19928762
-
Vitamin D supplementation inhibits oxidative stress and upregulate SIRT1/AMPK/GLUT4 cascade in high glucose-treated 3T3L1 adipocytes and in adipose tissue of high fat diet-fed diabetic mice.Arch Biochem Biophys. 2017 Feb 1;615:22-34. doi: 10.1016/j.abb.2017.01.002. Epub 2017 Jan 4. Arch Biochem Biophys. 2017. PMID: 28063949
-
Role of nutraceutical SIRT1 modulators in AMPK and mTOR pathway: Evidence of a synergistic effect.Nutrition. 2017 Feb;34:82-96. doi: 10.1016/j.nut.2016.09.008. Epub 2016 Oct 3. Nutrition. 2017. PMID: 28063518
-
Role of SIRT1 and AMPK in mesenchymal stem cells differentiation.Ageing Res Rev. 2014 Jan;13:55-64. doi: 10.1016/j.arr.2013.12.002. Epub 2013 Dec 12. Ageing Res Rev. 2014. PMID: 24333965 Review.
-
Antagonistic crosstalk between NF-κB and SIRT1 in the regulation of inflammation and metabolic disorders.Cell Signal. 2013 Oct;25(10):1939-48. doi: 10.1016/j.cellsig.2013.06.007. Epub 2013 Jun 11. Cell Signal. 2013. PMID: 23770291 Review.
Cited by
-
Natural Products for Liver Cancer Treatment: From Traditional Medicine to Modern Drug Discovery.Nutrients. 2022 Oct 12;14(20):4252. doi: 10.3390/nu14204252. Nutrients. 2022. PMID: 36296934 Free PMC article. Review.
-
Regulation of Gene Expression through Food-Curcumin as a Sirtuin Activity Modulator.Plants (Basel). 2022 Jun 30;11(13):1741. doi: 10.3390/plants11131741. Plants (Basel). 2022. PMID: 35807694 Free PMC article. Review.
-
Gut microbiota modulation of chemotherapy efficacy and toxicity.Nat Rev Gastroenterol Hepatol. 2017 Jun;14(6):356-365. doi: 10.1038/nrgastro.2017.20. Epub 2017 Mar 8. Nat Rev Gastroenterol Hepatol. 2017. PMID: 28270698 Review.
-
The role of AMPK in cancer metabolism and its impact on the immunomodulation of the tumor microenvironment.Front Immunol. 2023 Feb 15;14:1114582. doi: 10.3389/fimmu.2023.1114582. eCollection 2023. Front Immunol. 2023. PMID: 36875093 Free PMC article. Review.
-
Curcumin Treatment in Combination with Glucose Restriction Inhibits Intracellular Alkalinization and Tumor Growth in Hepatoma Cells.Int J Mol Sci. 2019 May 14;20(10):2375. doi: 10.3390/ijms20102375. Int J Mol Sci. 2019. PMID: 31091659 Free PMC article.
References
-
- Bost F, Sahra IB, Marchand-Brustel YL, Tanti JF. (2012). Metformin and cancer therapy. Curr Opin Oncol 24:103–108. - PubMed
-
- Bravata DM, Sanders L, Huang J, Krumholz HM, Olkin I, Gardner CD, et al. (2003). Efficacy and safety of low-carbohydrate diets. A systemic review. JAMA 289:1837–1850. - PubMed
-
- Calnan DR, Brunet A. (2008). The FoxO code. Oncogene 27:2276–2288. - PubMed
Publication types
MeSH terms
Substances
LinkOut - more resources
Full Text Sources
Other Literature Sources
Medical
Research Materials
Miscellaneous

