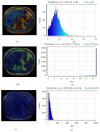
Diagnostic value of MRI proton density fat fraction for assessing liver steatosis in chronic viral C hepatitis
- PMID: 25866807
- PMCID: PMC4383409
- DOI: 10.1155/2015/758164
Diagnostic value of MRI proton density fat fraction for assessing liver steatosis in chronic viral C hepatitis
Abstract
Objective: To assess the diagnostic performance of a T1-independent, T2*-corrected multiecho magnetic resonance imaging (MRI) technique for the quantification of hepatic steatosis in a cohort of patients affected by chronic viral C hepatitis, using liver biopsy as gold standard.
Methods: Eighty-one untreated patients with chronic viral C hepatitis were prospectively enrolled. All included patients underwent MRI, transient elastography, and liver biopsy within a time interval <10 days.
Results: Our cohort of 77 patients included 43/77 (55.8%) males and 34/77 (44.2%) females with a mean age of 51.31 ± 11.27 (18-81) years. The median MRI PDFF showed a strong correlation with the histological fat fraction (FF) (r = 0.754, 95% CI 0.637 to 0.836, P < 0.0001), and the correlation was influenced by neither the liver stiffness nor the T2* decay. The median MRI PDFF result was significantly lower in the F4 subgroup (P < 0.05). The diagnostic accuracy of MRI PDFF evaluated by AUC-ROC analysis was 0.926 (95% CI 0.843 to 0.973) for S ≥ 1 and 0.929 (95% CI 0.847 to 0.975) for S = 2.
Conclusions: Our MRI technique of PDFF estimation allowed discriminating with a good diagnostic accuracy between different grades of hepatic steatosis.
Figures


Similar articles
-
Can negligible hepatic steatosis determined by magnetic resonance imaging-proton density fat fraction obviate the need for liver biopsy in potential liver donors?Liver Transpl. 2018 Apr;24(4):470-477. doi: 10.1002/lt.24965. Epub 2018 Mar 6. Liver Transpl. 2018. PMID: 29080242
-
Hepatic steatosis: quantification by proton density fat fraction with MR imaging versus liver biopsy.Radiology. 2013 Jun;267(3):767-75. doi: 10.1148/radiol.13121360. Epub 2013 Feb 4. Radiology. 2013. PMID: 23382293
-
Quantifying steatosis in the liver and pancreas with MRI in patient with chronic liver disease.Radiologia (Engl Ed). 2020 May-Jun;62(3):222-228. doi: 10.1016/j.rx.2019.11.007. Epub 2020 Jan 10. Radiologia (Engl Ed). 2020. PMID: 31932016 English, Spanish.
-
Accuracy of multiecho magnitude-based MRI (M-MRI) for estimation of hepatic proton density fat fraction (PDFF) in children.J Magn Reson Imaging. 2015 Nov;42(5):1223-32. doi: 10.1002/jmri.24888. Epub 2015 Apr 3. J Magn Reson Imaging. 2015. PMID: 25847512 Free PMC article.
-
A comparison of liver fat content as determined by magnetic resonance imaging-proton density fat fraction and MRS versus liver histology in non-alcoholic fatty liver disease.Acta Radiol. 2016 Mar;57(3):271-8. doi: 10.1177/0284185115580488. Epub 2015 Apr 8. Acta Radiol. 2016. PMID: 25855666
Cited by
-
Assessment of a high-SNR chemical-shift-encoded MRI with complex reconstruction for proton density fat fraction (PDFF) estimation overall and in the low-fat range.J Magn Reson Imaging. 2019 Jan;49(1):229-238. doi: 10.1002/jmri.26168. Epub 2018 Apr 29. J Magn Reson Imaging. 2019. PMID: 29707848 Free PMC article.
-
MRI and MRE for non-invasive quantitative assessment of hepatic steatosis and fibrosis in NAFLD and NASH: Clinical trials to clinical practice.J Hepatol. 2016 Nov;65(5):1006-1016. doi: 10.1016/j.jhep.2016.06.005. Epub 2016 Jun 14. J Hepatol. 2016. PMID: 27312947 Free PMC article. Review.
-
Comparison between different software programs and post-processing techniques for the MRI quantification of liver iron concentration in thalassemia patients.Radiol Med. 2016 Oct;121(10):751-62. doi: 10.1007/s11547-016-0661-2. Epub 2016 Jun 22. Radiol Med. 2016. PMID: 27334009
-
Chinese tree shrews as a primate experimental animal eligible for the study of alcoholic liver disease: characterization and confirmation by MRI.Exp Anim. 2020 Jan 29;69(1):110-118. doi: 10.1538/expanim.19-0073. Epub 2019 Sep 26. Exp Anim. 2020. PMID: 31554748 Free PMC article.
-
Characteristics of Urine Organic Acid Metabolites in Nonalcoholic Fatty Liver Disease Assessed Using Magnetic Resonance Imaging with Elastography in Korean Adults.Diagnostics (Basel). 2022 May 11;12(5):1199. doi: 10.3390/diagnostics12051199. Diagnostics (Basel). 2022. PMID: 35626354 Free PMC article.
References
-
- Adinolfi L. E., Gambardella M., Andreana A., Tripodi M.-F., Utili R., Ruggiero G. Steatosis accelerates the progression of liver damage of chronic hepatitis C patients and correlates with specific HCV genotype and visceral obesity. Hepatology. 2001;33(6):1358–1364. doi: 10.1053/jhep.2001.24432. - DOI - PubMed
Publication types
MeSH terms
Substances
LinkOut - more resources
Full Text Sources
Other Literature Sources
Medical

