. 2015 Jul;138(Pt 7):1875-93.
doi: 10.1093/brain/awv102. Epub 2015 Apr 22.

Fibroblast growth factor signalling in multiple sclerosis: inhibition of myelination and induction of pro-inflammatory environment by FGF9

Affiliations

Fibroblast growth factor signalling in multiple sclerosis: inhibition of myelination and induction of pro-inflammatory environment by FGF9

Maren Lindner et al. Brain. 2015 Jul.

Abstract

Remyelination failure plays an important role in the pathophysiology of multiple sclerosis, but the underlying cellular and molecular mechanisms remain poorly understood. We now report actively demyelinating lesions in patients with multiple sclerosis are associated with increased glial expression of fibroblast growth factor 9 (FGF9), which we demonstrate inhibits myelination and remyelination in vitro. This inhibitory activity is associated with the appearance of multi-branched 'pre-myelinating' MBP+ / PLP+ oligodendrocytes that interact with axons but fail to assemble myelin sheaths; an oligodendrocyte phenotype described previously in chronically demyelinated multiple sclerosis lesions. This inhibitory activity is not due to a direct effect of FGF9 on cells of the oligodendrocyte lineage but is mediated by factors secreted by astrocytes. Transcriptional profiling and functional validation studies demonstrate that these include effects dependent on increased expression of tissue inhibitor of metalloproteinase-sensitive proteases, enzymes more commonly associated with extracellular matrix remodelling. Further, we found that FGF9 induces expression of Ccl2 and Ccl7, two pro-inflammatory chemokines that contribute to recruitment of microglia and macrophages into multiple sclerosis lesions. These data indicate glial expression of FGF9 can initiate a complex astrocyte-dependent response that contributes to two distinct pathogenic pathways involved in the development of multiple sclerosis lesions. Namely, induction of a pro-inflammatory environment and failure of remyelination; a combination of effects predicted to exacerbate axonal injury and loss in patients.

Keywords: FGF; chemokines; inflammation; multiple sclerosis (MS); remyelination.


Figures

None
The failure of remyelination in multiple sclerosis is largely unexplained. Lindner et al. report that glial cells in demyelinating lesions show increased expression of fibroblast growth factor 9 (FGF9). This induces astrocyte-dependent responses that inhibit remyelination and stimulate expression of pro-inflammatory chemokines, supporting a feedback loop that amplifies disease activity
Figure 1
Figure 1
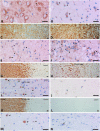
FGF9 is upregulated in multiple sclerosis lesions. (A) In control grey matter we detected intense extensive granular FGF9 immunoreactivity in the cytoplasm of cortical neurons superimposed on weaker diffuse granular immunoreactivity in the parenchyma. We also observed weak granular reactivity in some glia cells (arrows) and in association with the vessel wall (arrowhead). (B) Immunoreactivity was less pronounced in subcortical white matter although we still detected immunoreactivity in neurons (arrows), as well as weak reactivity in occasional cells with astrocyte morphology (arrowheads). (C and D) Active multiple sclerosis lesion of a patient with acute multiple sclerosis. (C) Myelin is lost in the plaque (right) in comparison to the periplaque white matter and is taken up by macrophages in the lesions. Immunocytochemical staining for MOG. (D) Immunocytochemistry for macrophages shows profound infiltration of the lesion (right) and massive microglia activation at the lesion edge (left). (E) Expression in normal appearing white matter is intermediate between that seen in active lesions and control white matter and is characterized by variable staining of oligodendrocyte-like cells (arrow), astrocytes (arrowhead) and vessel associated cells (asterisk). (F) Immunoreactivity for FGF9 was far more pronounced in active lesions compared to control white matter. Strong expression was observed in cells with oligodendrocyte morphology (arrows), weaker expression in astrocytes (arrowheads) as well as other cell types, possibly OPCs. Rim of an early active lesion from case of acute multiple sclerosis, disease duration, 2 months. (G and H) Slowly expanding lesions in progressive multiple sclerosis are defined by myelin loss and the presence of some macrophages at the lesion border with myelin degradation products (G); there is massive microglia activation at the lesions edge and some immunoreactive cells have macrophage morphology (H). (I) FGF9 immunoreactivity is increased at the edge of slowly expanding white matter lesions from cases of progressive disease. In this case immunoreactivity is associated with axonal spheroids (arrows) and glia (arrowhead). Rim of a slowly expanding lesion from a case of primary progressive multiple sclerosis. (J) The centre of chronic active lesions show very limited astrocytic immunoreactivity for FGF9. (K and L) Inactive lesions show myelin loss with a sharp border towards the periplaque white matter (PPWM) (K) and no immunoreactivity for macrophage antigens (e.g. CD68) within or around the lesion (L). Immunoreactivity for FGF9 across inactive chronic lesions is far lower than in control white matter as seen at the lesion rim (M) where immunoreactivity is associated with an axonal spheroid (arrow) as well as weaker and variable staining of glia (arrowheads). In the centre of the same lesion (N) weak immunoreactivity is seen associated with a single cell, morphologically consistent with an endothelial cell. (K–N) Inactive lesion from a case of secondary progressive multiple sclerosis with a duration of >35 years. Scale bar in all panels corresponds to 20 µm.
Figure 2
Figure 2
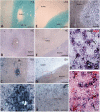
In active lesions FGF9 is expressed by cells of the oligodendrocyte lineage. In situ hybridization (ISH) was performed on fresh frozen post-mortem multiple sclerosis brain tissue with active and chronic active white matter lesions identified by Luxol Fast blue (LFB) (A and E, respectively). B and F show the corresponding haematoxylin and eosin (HE) staining of consecutive tissue sections. In situ hybridization for FGF9 transcripts show high level of expression within active lesion (C and D, higher magnification), increased expression in the edge of chronic active lesions (G and H, higher magnification), and high expression in cerebral cortex (I), whereas in normal-appearing white matter (NAWM) FGF9 is expressed at low levels (H and I). Immunohistochemical colocalization detects FGF9 transcripts mainly in OLIG2-positive cells (K, arrows), but also in a small number of GFAP-positive cells (L, arrows) although most GFAP-positive cells were negative (arrowhead). Scale bar = 500 µm in A–C, E–G and I; 100 µm in D and H; and 25 µm in K and L.
Figure 3
Figure 3
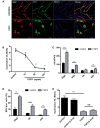
FGF9 inhibits myelination and expands OPC numbers in vitro. Oligodendrocytes in untreated cultures myelinate multiple axons (A); MBP (red) reactivity is predominantly associated with myelin sheaths, whereas PLP (green) immunoreactivity is also present in the oligodendrocyte cell body. Treatment with 100 ng/ml FGF9 from 18–28 DIV is associated with the appearance of multi-branched oligodendrocytes that exhibit a granular staining pattern for MBP and PLP in the cell body and fail to generate myelin sheaths. MBP, red; PLP, green; SMI31, blue. Scale bar = 20 µm. Inhibition of myelination by FGF9 in these cultures is dose-dependent (B); myelination was quantified using a MOG-specific antibody as described in the text. This treatment is associated with increased numbers of OLIG2+ (P < 0.001), NG2+ (P < 0.01) and AA3+ (P < 0.01) cells. There was also a trend for O4+ cell numbers to increase, but this did not reach significance (P = 0.055) (C). This increase in OPC numbers was due to proliferation as demonstrated by the presence of increased numbers of OLIG2, O4 and AA3 (PLP/DM20) immunoreactive cells labelled with EdU (DIV 18–22) (D). However, the ability of FGF9 to inhibit myelination is independent of this proliferative response as inhibition of proliferation by cytosine arabinoside (AraC, 20 µM) was unable to abrogate inhibition of myelination by FGF9 (E). Data are presented as mean ± SEM obtained from a minimum of three experiments; *P < 0.05; **P < 0.01; ***P < 0.001.
Figure 4
Figure 4
FGF9 compromises remyelination in organotypic slices. Cerebellar slices from post-natal Day 2 mouse pups were cultured for 10 days and then demyelinated using LPC for 16 h. Cultures were then allowed to remyelinate over the next 14 days in the presence or absence of FGF9 (100 ng/ml) after which remyelination was assessed using antibodies specific for MOG and PLP to label myelin, and neurofilament (NFH) to label axons. Confocal immunofluorescence microscopy shows treatment with FGF9 leads to less remyelination (A) as demonstrated by the reduction in MOG+ internodes (red) and PLP+ internodes (green) encasing NFH+ axons (blue). Scale bar = 10 µm. Remyelination was quantified using image analysis to define co-localization of staining for myelin (PLP+ or MOG+) and axons (NFH+) (B)—a quantification of myelinated internodes we term the remyelination index (amount of myelin/axon). Irrespective of the antibody used to identify myelinated internodes, treatment with FGF9 (F) reduced remyelination compared to untreated cultures (C). Mean ± SEM (n = 3, at least six slices per experiment; ***P < 0.001; **P < 0.01.
Figure 5
Figure 5
FGF9 inhibits OPC differentiation directly and induces secretion of myelination-inhibiting factors by astrocytes. Proliferation of immunopurified A2B5+ OPCs cultured in the presence or absence of FGF9. FGF9 is not initially an OPC mitogen (DIV 1–3), but progenitors become responsive as they differentiate (DIV 4–7) (A). This proliferative response is associated with inhibition of OPC differentiation assessed using three stage specific markers (O4, PLP and MOG) (B and C). B provides representative images demonstrating the effect on expression of PLP and MOG. Scale bar = 100 µm. Supernatants from FGF9 treated and untreated neurosphere-derived astrocytes were harvested and added to myelinating cultures in the presence or absence of a neutralizing anti-FGF9 antibody (10 μg/ml) from 18 to 28 DIV (D). Quantifying PLP+ myelination reveals the FGF9-specific antibody neutralized the ability of FGF9 to inhibit myelination, but failed to block inhibitory activity present in supernatants harvested from FGF9-treated astrocytes. (A, C and D) Data represent means ± SEM from at least three independent experiments; ***P < 0.001; **P < 0.01; *P < 0.05, n.s. = not significant.
Figure 6
Figure 6
Transcriptional profiling of the effects of FGF9 in myelinating cultures. (A) Volcano plot of fold-change versus log10 significance reveals FGF9 upregulated a cluster of pro-inflammatory genes (dark blue) including Ccl7 and Ccl2; induced expression changes indicative of extracellular matrix remodelling (red); modulated the relative expression of IL6/gp130 gene family members (light blue) and uniformly reduced expression of myelin associated genes. (B) Aggrecanase activity was assayed in supernatants from myelinating cultures grown in the presence or absence of FGF9 for 72 h. Cell culture supernatants protolytically cleave a recombinant aggrecan substrate into ARGSVIL-peptide which is then measured by ELISA. Data represent the mean ± SEM of seven independent experiments, *P < 0.05. (C) Myelinating cultures were treated with FGF9 for 10 days in the absence or presence of tissue inhibitors of metalloproteinases (TIMP1, TIMP2 and TIMP3; each at 1 µg/ml) after which myelination was quantified, as described in the text. This cocktail of TIMPS had no effect on basal levels of myelination, but abrogated inhibition of myelination by FGF9. Representative data (mean ± SEM) from one of three independent experiments.

Similar articles

Cited by

References

    1. Azim K, Raineteau O, Butt AM. Intraventricular injection of FGF-2 promotes generation of oligodendrocyte-lineage cells in the postnatal and adult forebrain. Glia. 2012;60:1977–90. - PubMed
    1. Back SA, Tuohy TM, Chen H, Wallingford N, Craig A, Struve J, et al. Hyaluronan accumulates in demyelinated lesions and inhibits oligodendrocyte progenitor maturation. Nat Med. 2005;11:966–72. - PubMed
    1. Bansal R. Fibroblast growth factors and their receptors in oligodendrocyte development: implications for demyelination and remyelination. Dev Neurosci. 2002;24:35–46. - PubMed
    1. Bansal R, Pfeiffer SE. Inhibition of protein and lipid sulfation in oligodendrocytes blocks biological responses to FGF-2 and retards cytoarchitectural maturation, but not developmental lineage progression. Dev Biol. 1994;162:511–24. - PubMed
    1. Bottenstein JE, Sato GH. Growth of rat neuroblastoma cell line in serum-free supplemented medium. Proc Natl Acad Sci USA. 1979;76:514–17. - PMC - PubMed

Publication types

MeSH terms

  NODES
Association 1
INTERN 4
Project 1
twitter 2