Systemic Delivery of scAAV8-Encoded MiR-29a Ameliorates Hepatic Fibrosis in Carbon Tetrachloride-Treated Mice
- PMID: 25923107
- PMCID: PMC4414421
- DOI: 10.1371/journal.pone.0124411
Systemic Delivery of scAAV8-Encoded MiR-29a Ameliorates Hepatic Fibrosis in Carbon Tetrachloride-Treated Mice
Abstract
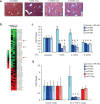
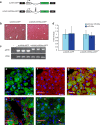
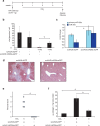
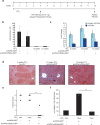
Fibrosis refers to the accumulation of excess extracellular matrix (ECM) components and represents a key feature of many chronic inflammatory diseases. Unfortunately, no currently available treatments specifically _target this important pathogenic mechanism. MicroRNAs (miRNAs) are short, non-coding RNAs that post-transcriptionally repress _target gene expression and the development of miRNA-based therapeutics is being actively pursued for a diverse array of diseases. Because a single miRNA can _target multiple genes, often within the same pathway, variations in the level of individual miRNAs can potently influence disease phenotypes. Members of the miR-29 family, which include miR-29a, miR-29b and miR-29c, are strong inhibitors of ECM synthesis and fibrosis-associated decreases in miR-29 have been reported in multiple organs. We observed downregulation of miR-29a/b/c in fibrotic livers of carbon tetrachloride (CCl4) treated mice as well as in isolated human hepatocytes exposed to the pro-fibrotic cytokine TGF-β. Importantly, we demonstrate that a single systemic injection of a miR-29a expressing adeno-associated virus (AAV) can prevent and even reverse histologic and biochemical evidence of fibrosis despite continued exposure to CCl4. The observed therapeutic benefits were associated with AAV transduction of hepatocytes but not hepatic stellate cells, which are the main ECM producing cells in fibroproliferative liver diseases. Our data therefore demonstrate that delivery of miR-29 to the hepatic parenchyma using a clinically relevant gene delivery platform protects injured livers against fibrosis and, given the consistent fibrosis-associated downregulation of miR-29, suggests AAV-miR-29 based therapies may be effective in treating a variety of fibroproliferative disorders.
Conflict of interest statement
Figures


Similar articles
-
MicroRNA-101 suppresses liver fibrosis by _targeting the TGFβ signalling pathway.J Pathol. 2014 Sep;234(1):46-59. doi: 10.1002/path.4373. Epub 2014 Jun 17. J Pathol. 2014. PMID: 24817606
-
miR-30c and miR-193 are a part of the TGF-β-dependent regulatory network controlling extracellular matrix genes in liver fibrosis.J Dig Dis. 2015 Sep;16(9):513-24. doi: 10.1111/1751-2980.12266. J Dig Dis. 2015. PMID: 26120970
-
Protective role of estrogen-induced miRNA-29 expression in carbon tetrachloride-induced mouse liver injury.J Biol Chem. 2012 Apr 27;287(18):14851-62. doi: 10.1074/jbc.M111.314922. Epub 2012 Mar 5. J Biol Chem. 2012. PMID: 22393047 Free PMC article.
-
MicroRNA interplay between hepatic stellate cell quiescence and activation.Eur J Pharmacol. 2020 Oct 15;885:173507. doi: 10.1016/j.ejphar.2020.173507. Epub 2020 Aug 25. Eur J Pharmacol. 2020. PMID: 32858048 Review.
-
The Role of miR-29a in the Regulation, Function, and Signaling of Liver Fibrosis.Int J Mol Sci. 2018 Jun 27;19(7):1889. doi: 10.3390/ijms19071889. Int J Mol Sci. 2018. PMID: 29954104 Free PMC article. Review.
Cited by
-
Safety and Efficacy of AAV Retrograde Pancreatic Ductal Gene Delivery in Normal and Pancreatic Cancer Mice.Mol Ther Methods Clin Dev. 2017 Sep 30;8:8-20. doi: 10.1016/j.omtm.2017.09.006. eCollection 2018 Mar 16. Mol Ther Methods Clin Dev. 2017. PMID: 29349096 Free PMC article.
-
Hepatic Stellate Cells and microRNAs in Pathogenesis of Liver Fibrosis.J Clin Med. 2016 Mar 16;5(3):38. doi: 10.3390/jcm5030038. J Clin Med. 2016. PMID: 26999230 Free PMC article. Review.
-
A General Overview on Non-coding RNA-Based Diagnostic and Therapeutic Approaches for Liver Diseases.Front Pharmacol. 2018 Aug 15;9:805. doi: 10.3389/fphar.2018.00805. eCollection 2018. Front Pharmacol. 2018. PMID: 30158867 Free PMC article. Review.
-
[Non-coding RNA : Innovative regulators with therapeutic perspective].Herz. 2018 Mar;43(2):115-122. doi: 10.1007/s00059-017-4660-4. Herz. 2018. PMID: 29236145 Review. German.
-
The MicroRNA 29 Family Promotes Type II Cell Differentiation in Developing Lung.Mol Cell Biol. 2016 Jul 29;36(16):2141. doi: 10.1128/MCB.00096-16. Print 2016 Aug 15. Mol Cell Biol. 2016. PMID: 27215389 Free PMC article.
References
-
- Wynn TA. Cellular and molecular mechanisms of fibrosis. Altmann DM, Douek DC, editors. J Pathol [Internet]. 2007 ed. 2008. January;214(2):199–210. Available from: http://www.ncbi.nlm.nih.gov/entrez/query.fcgi?cmd=Retrieve&db=PubMed&dop... - PMC - PubMed
-
- Bartel DP. MicroRNAs: _target Recognition and Regulatory Functions. Cell [Internet]. 2009 ed. 2009. January 23;136(2):215–33. Available from: http://www.ncbi.nlm.nih.gov/entrez/query.fcgi?cmd=Retrieve&db=PubMed&dop... 10.1016/j.cell.2009.01.002 - DOI - PMC - PubMed
Publication types
MeSH terms
Substances
Grants and funding
LinkOut - more resources
Full Text Sources
Other Literature Sources
Medical

