. 2015 Oct 1;406(1):14-39.
doi: 10.1016/j.ydbio.2015.06.021. Epub 2015 Jun 30.

Lineage-associated tracts defining the anatomy of the Drosophila first instar larval brain

Affiliations

Lineage-associated tracts defining the anatomy of the Drosophila first instar larval brain

Volker Hartenstein et al. Dev Biol. .

Abstract

Fixed lineages derived from unique, genetically specified neuroblasts form the anatomical building blocks of the Drosophila brain. Neurons belonging to the same lineage project their axons in a common tract, which is labeled by neuronal markers. In this paper, we present a detailed atlas of the lineage-associated tracts forming the brain of the early Drosophila larva, based on the use of global markers (anti-Neuroglian, anti-Neurotactin, inscuteable-Gal4>UAS-chRFP-Tub) and lineage-specific reporters. We describe 68 discrete fiber bundles that contain axons of one lineage or pairs/small sets of adjacent lineages. Bundles enter the neuropil at invariant locations, the lineage tract entry portals. Within the neuropil, these fiber bundles form larger fascicles that can be classified, by their main orientation, into longitudinal, transverse, and vertical (ascending/descending) fascicles. We present 3D digital models of lineage tract entry portals and neuropil fascicles, set into relationship to commonly used, easily recognizable reference structures such as the mushroom body, the antennal lobe, the optic lobe, and the Fasciclin II-positive fiber bundles that connect the brain and ventral nerve cord. Correspondences and differences between early larval tract anatomy and the previously described late larval and adult lineage patterns are highlighted. Our L1 neuro-anatomical atlas of lineages constitutes an essential step towards following morphologically defined lineages to the neuroblasts of the early embryo, which will ultimately make it possible to link the structure and connectivity of a lineage to the expression of genes in the particular neuroblast that gives rise to that lineage. Furthermore, the L1 atlas will be important for a host of ongoing work that attempts to reconstruct neuronal connectivity at the level of resolution of single neurons and their synapses.

Keywords: Brain; Development; Drosophila; Larval; Lineage.


Figures

Figure 1
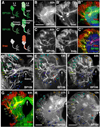
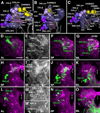
Figure 1. Reconstruction of lineage-associated axon tracts in the developing larval brain
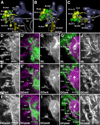
(A–C”) Developing lineages labeled by three global neuronal markers: anti-Neuroglian (BP104), anti-Neurotactin (BP106), and insc-Gal4, UAS-chRFP-Tub. (B–B”) and (C–C”) are z-projections of confocal sections of a 60h larval brain hemisphere. BP104 strongly labels primary neurons and primary axon tracts (PATs; green) in the early larva (L1 in A); it remains strongly expressed in PATs at mid larval stages (early L3; 60h in A; B, B”). BP106 is expressed only faintly in primary neurons (A), and strongly in secondary neurons and axon tracts (SATs; green in A, right; C, C”). insc-Gal4 is not expressed in primary neurons of the larval brain; it only labels secondary neurons and SATs (red in A; B”; C”). Note co-labeling of PATs with BP104 and SATs with insc-Gal4 in panel B”. Neuropil is labeled by anti-DN-cadherin (DNcad; blue) in B” and C”. (D–I) Z-projections of frontal confocal sections of larval brain hemispheres labeled with BP106 (D–F), insc-Gal4/BP104 (G) and BP104 (H–I). The antibodies/Gal4 drivers mark SATs (D–G) and PATs (G–I) of specific lineages, identified by numbers (see Table 2 for correspondence of lineage name and number). In Panel G, similar to B” above, PATs and SATs are co-labeled by insc-Gal4/BP104. All z-projections cover a brain slice of 12–15µm thickness, located at the same antero-posterior level. SATs/PATs can be identified on the basis of their characteristic points of entry and trajectory; note, for example, the crescent-shaped tract formed by the DPLal1–3 lineages (#33* in D–I), the entry of DPLam (#36) medially adjacent to DPLal, the convergence of BLAd (#68*) latero-ventral of DPLal, the convergence of BLAv (#73–75) ventral of BLAd, the convergence of BAlp1–3 (#6–8) ventro-medially of BLAv, the long descending tract, passing over peduncle, formed by DALcm1–2 (#20*) and DALd (#22), or the ventral longitudinal tract formed by BAmv1–2 (#15*). Red arrows in (E) point at the two separable SATs of BAmv1 and BAmv2 in 72h brain; the corresponding primary tracts form a single bundle in 12h brain (red arrowhead in I). White arrows in Panels D–I indicate brain midline. Bars: 50µm (B–G); 20µm (H, I)
Figure 2
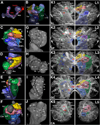
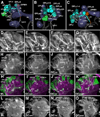
Figure 2. Architecture of the first instar (L1) larval brain
(A, B) Digital 3D model of mushroom body, antero-lateral view. Mushroom body is rendered in blue grey (A–B; CA calyx; ML medial lobe; PED peduncle; SP spur; VL vertical lobe). In (A), an individual mushroom body neuron (Kenyon cell) is shown in red. In (B), neuropil compartments surrounding the mushroom body are shown in a semitransparent manner and in the same colors used in the following panels. (C–F) Digital 3D models of L1 brain hemispheres shown in different views (C: anterior; D: dorsal; E: lateral; F: posterior). Midline indicated by white arrow. Mushroom body rendered in grey, compartments in different colors. (G–J) Volume renderings of L1 brain neuropil labeled with anti-DNcadherin, visualizing relief of neuropil surface. Except for I, each panel shows the contralateral brain hemisphere in the same view as 3D model to the left (G: anterior; H: dorsal; I: lateral; J: posterior). Numbered hatched circles indicate entry portals of lineage associated tracts. (K1–5, L1–5): Z-projections of frontal confocal sections of a L1 brain hemisphere labeled with anti-Neuroglian (BP104), illustrating lineages and lineage-associated fiber bundles (K1–5) in the context of larval brain neuropil compartments (L1–L5). Each z-projection represents a brain slice of approximately 8–10µm thickness. Z-projections are presented in anterior (K1/L1) to posterior (K5/L5) order. Details of the anatomy of the mushroom body and surrounding structures present distinct “hallmarks” for a z-projection taken at a specific antero-posterior level (appear in red in K1–K5). These hallmarks are used in this and all following figures to define and name the antero-posterior level represented in the corresponding z-projection. The anterior level (“AL”; K1, L1) includes the neuropil anterior of the MB lobes, notably the antennal lobe (AL) and lateral appendix of the medial lobe (LAML); the second level (“SP”; K2, L2) is defined by the mushroom body spur (SP) and junction between vertical lobe (VL) and medial lobe (ML); the third slice (“ML”; K3, L3) contains the distal tips of the ML. The fourth level (“GC”; K4, L4) is defined by the posterior commissures, notably the great commissure (GC) and the primordium of the fan-shaped body (prFB). The posterior level (“CA”; K5, L5) shows the junction between the peduncle (PED) and calyx (CA). In panels K1–K5, lineages and neuropil fiber tracts are annotated with white lettering and blue lettering, respectively. White arrows in (L2) point at two examples of clusters of primary neurons that express higher levels of BP104 than surrounding cells. For additional information on lineages and fiber tracts they associate with, see Table 2. In panels L1–L5, which show the opposite hemisphere, compartments are rendered in different colors, following the color scheme used in panels B–F. For abbreviations of fiber tracts and compartments, see Table 1.Bar: 20µm (for all panels) Quick guide to neuropil compartments: Anterior compartments: The PENPa represents the neuropil domain flanking the esophagus. It is subdivided into a ventral domain (TRv), which appears as the anteriorly directed tip of the subesophageal ganglion (SEG; Fig.2C), and a dorsal domain (TRd). Both of these subdivisions receive input from the mouth cavity and foregut via the pharyngeal nerve (Rajashekhar and Singh, 1994); in view of its sensory input and internal lineage composition (discussed in detail in Kuert et al., 2015), the PENPa domain corresponds to the tritocerebrum defined in adult flies (Rajashekhar and Singh, 1994) and other insects. The antennal nerve, carrying olfactory stimuli, defines the AL compartment, located laterally of the PENPa (panels C, L1). The LAML (Selcho et al., 2009), which has no counterpart in the adult brain, is a hemispherical structure capping the spur of the mushroom body (panels C, L1). Further medially, the IPa forms a cuff-shaped compartment that surrounds the medial lobe of the mushroom body (panels C, L1–L2). Ventral compartments: The LAL is located ventrally of the MB medial lobe and spur, and dorso-posteriorly of the antennal lobe and periesophageal neuropil (panels B–C, E, L2). A vertically-oriented gap in the ventral brain neuropil defines the boundary between the LAL and laterally adjacent VLP (panels C, G) and, further posteriorly, between the VLP and VMC (see Supplementary Fig.S4B, C). Inferior protocerebrum: formed by compartments surrounding the lobes and peduncle of the mushroom body. Posterior to the anteriorly located IPa (flanking the medial lobe; see above) is the medial inferior protocerebrum (IPm). The IPm is separated from the postero-medially adjacent posterior inferior protocerebrum (IPp) by a robust mass of fibers/glia formed by the antennal lobe tract (ALT) and medial equatorial fascicle (MEF; panels K4, L4). A virtual vertical plane through the peduncle separates the IPm from the lateral inferior protocerebrum (IPl; Fig.2L3–L5). Borders between IPm/l and ventrally adjacent VMC and VLP, respectively, are defined by several primary axon tracts (e.g., PLF; panels K4, L4; see also Supplementary Fig.S4H). Superior protocerebrum: The superior medial protocerebrum (SMP) lies dorsal of the IPa and is bounded medially by the vertical lobe of the mushroom body (VL; panels C–D, F, L2–L3). Posterior of the vertical lobe, axon bundles of the DPLc lineages (see below) separate the SMP from the laterally adjacent superior lateral protocerebrum (SLP; panels K4, L4). Several longitudinally and transversally oriented fiber bundles (longitudinal superior medial and superior lateral fascicles (loSM, loSL); transverse superior fascicles (trSA/I/P); see below) delineate the border between the superior and inferior protocerebral compartments (panels K3–K4, L3–L4; and Supplementary Fig.S4G, H).
Figure 3
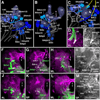
Figure 3. Association of brain lineages and tracts with FasII-positive fiber bundles
(A) Z-projection of horizontal confocal sections of L1 larval anterior ventral nerve cord and basal brain, labeled with FasII-Gal4 (magenta) and anti-Neuroglian (BP104, green). FasII is expressed on each side in three pairs of long fiber tracts (CITd/v dorsal and ventral component of central intermediate tract; DLT dorsal lateral tract; VMT/DMT ventral and dorsal medial tract). These tracts anastomose in the anterior nerve cord (subesophageal ganglion, SEG) and continue as the cervical tracts into the basal brain (LCT lateral cervical tract; MCT medial cervical tract; PCT posterior cervical tract). (B–C) 3D digital model of FasII-positive tracts (yellow, orange) in spatial relationship to central brain neuropil tracts (blue), selected lineages (red) and central brain neuropil compartments. Anterior view (B) and lateral view (C). (D–F): Z-projections of frontal confocal section of third instar brain labeled with insc-Gal4, UAS-chRFP-Tub (magenta; labels secondary lineages) and anti-FasII (green). The three cervical tracts and their projections in the brain are shown separately [D: medial cervical tract (MCT); E: lateral cervical tract (LCT); F: posterior cervical tract (PCT)]. For abbreviations of compartments and tracts see Table 1. Bars: 20µm (A); 50µm (D–F)
Figure 4
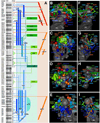
Figure 4. Synopsis of lineages and neuropil tracts
(A): List of lineages (first column), associated PAT tracts (second column), and neuropil entry portals (third column). Neuropil fiber tracts are represented by colored bars at the right of panels; longitudinal tracts are in blue, transverse tracts/commissures in green, ascending and descending tracts in red and orange, respectively. Lines connect individual lineages (left) with the appropriate neuropil tracts (right). Lineages that project locally (according to specific labeling) are indicated by short gray lines and circles (third column); lineages for which no clear information exists are indicated by black oval in second column. (B–I) Digital 3D models of lineages (B–E) and tracts (F–I). Mushroom body and ventral brain neuropil compartments are shown semi-transparently for reference. Anterior view (B, F; medial to the left), lateral view (C, G; anterior to the left); dorsal view (D, H; medial to the right); posterior view (E, I; medial to the right). Coloring of lineages reflects their projection along longitudinal fiber system (blue), transverse system (green), or ascending/descending system (red or orange, respectively). For abbreviations of fiber tracts and compartments, see Table 1.
Figure 5
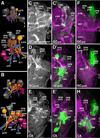
Figure 5. Tracts associated with baso-anterior (BA) lineages
(A–C): Digital 3D models of BA lineages and tracts in a single L1 brain hemisphere. Anterior view (A), lateral view (B), ventro-anterior view (C). Centers of cell body clusters of lineages are depicted as spheres; lineage-associated axon tracts are shown as lines. Mushroom body and antennal lobe (blue-gray) and FasII-positive tracts (dark gray) are shown for reference. Fiber bundles of neuropil formed by BA lineage tracts are shown in light gray. Numbered hatched circles in (A) and other panels represent entry portals of lineage-associated tracts. “d” and “v” in (A) indicate dorsal and ventral hemilineage tracts of BAmd1 and BAmd2, respectively. Arrow in (B, C) points at entry of ventral hemilineage of BAlc into loVI tract; small arrowhead in (B, C) indicates convergence of tracts of BAla1, BAlc, and BAlp4 into the antennal lobe tract (ALT); large arrowhead in (C) points at close parallel entry of antennal nerve (AN) and tracts of BAla1–4. Double-headed arrow in (A, C) and all other panels indicates brain midline. (D–M) Z-projections of frontal confocal sections of a single L1 brain hemisphere. Antero-posterior levels shown by z-projections are indicated by letters (AL, SP, ML) at lower left corner (for definition of levels, see Figure 2). Primary neurons and tracts are labeled by anti-Neuroglian (BP104; magenta in panels D, F–H, J–L; white in panels E, I, M). BP104-positive antennal nerve (AN) and pharyngeal nerve (PN) is highlighted in green in panel (D). Lineages BAmv1 and BAla1 are labeled by per-Gal4>UAS-mcd8::GFP (green in F–H); BAla3 is labeled by en-Gal4>UAS-mcd8::GFP (green in J–L). Panels (I) and (M) are high magnifications of central parts of (G) and (K), respectively. For abbreviations of compartments and fiber tracts see Table 1; for numbering of entry portals see Table 2. Bars: 10µm (D, E, I, M); 20µm (F–H; J–L)
Figure 6
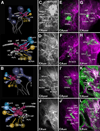
Figure 6. Tracts associated with dorso-anterior lateral (DAL) and dorso-anterior medial (DAM) lineages
(A–C): Digital 3D models of DAL and DAM lineages and tracts in a single L1 brain hemisphere. Anterior view (A), lateral view (B), dorsal view (C). Aside from mushroom body and antennal lobe (blue-gray) and FasII-positive tracts (dark gray), the lateral accessory lobe (LAL) and lateral appendix of the medial lobe (LAML; both in magenta-gray) are shown for reference. Fiber bundles of neuropil formed by DAL lineage tracts are shown in light gray. Numbered hatched circles in (A) and other panels represent entry portals of lineage-associated tracts. Double-headed arrow in (A, C) and all other panels indicate brain midline. (D–O) Z-projections of frontal confocal sections of a single L1 brain hemisphere. Antero-posterior levels shown by z-projections are indicated by letters (AL, SP, ML) at lower left corner (for definition of levels, see Figure 2). Primary neurons and tracts are labeled by anti-Neuroglian (BP104; magenta in panels D, F–H, J–L, N, O; white in panels E, I, M/M’). Lineage DALcl1 is labeled by R82E10-Gal4>UAS-mcd8::GFP (green in D, F–G); DALv2 is labeled by per-Gal4>UAS-mcd8:: GFP (green in H, J–K); DALv3 and DPLam are labeled by en-Gal4>UAS-mcd8:: GFP (green in L, N–O). Panels (E), (I), (M) and (M’) are high magnifications of central parts of (D), (J) and (N), respectively. For abbreviations of compartments and fiber tracts see Table 1; for numbering of entry portals see Table 2. Bars: 20µm (D, F, G, H, J–O); 10µm (E, I)
Figure 7
Figure 7. Tracts associated with dorso-posterior lateral (DPL) lineages
(A–C): Digital 3D models of DPL lineages and tracts in a single L1 brain hemisphere. Anterior view (A), lateral view (B), dorsal view (C). Mushroom body and antennal lobe (blue-gray) and FasII-positive tracts (dark gray) are shown for reference. Numbered hatched circles in (A) and other panels represent entry portals of lineage-associated tracts. Double-headed arrow in (A, C) and all other panels indicates brain midline. (D–O) Z-projections of frontal confocal sections of a single brain hemisphere of early L3 (64h; D–G), late L2 (48h; H–K’), and L1 (12h; L–O). Antero-posterior levels shown by z-projections are indicated by letters [ML, anterior GC level (GCant), intermediate GC level (GCint), posterior GC level (GCpost)] at lower left corner (for definition of levels, see Figure 2). Secondary lineages are labeled by anti-Neurotactin (BP106; white in D–G) or insc-Gal4>UAS-chRFP-Tub (green in H’–K’); primary neurons and tracts are labeled by anti-Neuroglian (BP104; white in H–K and L–O; magenta in H’–K’). For abbreviations of compartments and fiber tracts see Table 1; for numbering of entry portals see Table 2. Bar: 20µm (D–O)
Figure 8
Figure 8. Tracts associated with dorso-posterior medial (DPM) and centro-medial (CM) lineages
(A, B): Digital 3D models of DPM and CM lineages and tracts in a single L1 brain hemisphere. Anterior view (A), medial view (B). At top of each panel, lineages are shown in relationship to mushroom body (gray) for spatial orientation; bottom of panels shows higher magnification of lineages and neuropil tracts (light blue). Numbered hatched circles in (A) and other panels represent entry portals of lineage-associated tracts. Arrows in (A) and (B) point at convergence of tracts of DPMm1, DPMpm1/2, and CM4 to form a commissural tract that represents the primordium of the fan-shaped body (prFB). Letters “a”–“d” indicate additional tracts formed by these lineages (see text). Double-headed arrow in (A, C) and all other panels indicates brain midline. (C–H) Z-projections of frontal confocal sections of medial half of a L1 brain hemisphere (24h; C–E’) and L2 larva (48h; F–H). Antero-posterior levels shown by z-projections are indicated by letters (GCant, GCpost, CA) at lower left corner (for definition of levels, see Figure 2). Primary neurons and tracts are labeled by anti-Neuroglian (BP104; white in panels C–E; magenta in C’–H). Primary neurons representing the Type II lineages DPMm1, DPMpm1/2, CM1/3/4 are labeled by 9D11-Gal4>UAS-mcd8::GFP (green in C’–E’); from L2 onward, the same marker labels secondary neurons of these lineages (green in panels F–H). For abbreviations of compartments and fiber tracts see Table 1; for numbering of entry portals see Table 2. Bar: 20µm (C–H)
Figure 9
Figure 9. Tracts associated with posterior lineages (CP, BLP, DPLp)
(A, B): Digital 3D models of posterior lineages and tracts of a single L1 brain hemisphere. Lateral view (A), posterior view (B). At the top of each panel, lineages are shown in relationship to mushroom body (blue-grey) for spatial orientation; bottom of panels shows higher magnification of lineages and neuropil tracts (light blue). Numbered hatched circles in (A) and other panels represent entry portals of lineage-associated tracts. Double-headed arrow in (B) indicates brain midline. (C–L) Z-projections of frontal confocal sections of lateral half of brain hemisphere of L1 larva (24h; C–H), L2 larva (48h; I–J’), and early L3 larva (56h; K–L). Lateral in all panels is to the left. Antero-posterior levels shown by z-projections are indicated by letters (CAant, CApost) at lower left corner (for definition of levels, see Figure 2). Primary neurons and tracts are labeled by anti-Neuroglian (BP104; white in panels C–D, I, J; magenta in all other panels). Primary neurons representing the Type II lineages CP2 and CP3 are labeled by 9D11-Gal4>UAS-mcd8::GFP (green in E–F); from L2 onward, the same marker labels secondary neurons of these lineages (green in panels I’–J’). Primary neurons of CP1 are labeled by R76A11-Gal4>UAS-mcd8::GFP (green in G–H). Secondary neurons are globally labeled by insc-Gal4>UAS-chRFP-Tub (green in K–L). For abbreviations of compartments and fiber tracts see Table 1; for numbering of entry portals see Table 2. Bar: 20µm (C–L)
Figure 10
Figure 10. Tracts associated with lateral lineages (BLA, BLD, BLV)
(A–C): Digital 3D models of BL lineages and tracts in a single L1 brain hemisphere. Anterior view (A), postero-lateral view (B), dorsal view (C). Aside from mushroom body and antennal lobe (blue-gray) and FasII-positive tracts (dark gray), the larval optic neuropil (LON) is shown for reference. Fiber bundles of neuropil to which BL lineage tracts contribute are shown in light gray. Numbered hatched circles in (A) and other panels represent entry portals of lineage-associated tracts. (D–L) Z-projections of frontal confocal sections of lateral half of L1 brain hemisphere (24h; D–F’) and early L3 larva (64h; G–L). Lateral in all panels is to the left. Antero-posterior levels shown by z-projections are indicated by letters (ML, GCant, GCpost) at lower left corner (for definition of levels, see Figure 2). Primary neurons and tracts are labeled by anti-Neuroglian (BP104; white in panels D–F and G–I; magenta in D’–F’ and G’–I’). Primary neurons of BLD5, BLD6, BLVa3, and BLVa4 are labeled by R67A11-Gal4>UAS-mcd8::GFP (green in D’–F’). Secondary neurons are globally labeled by insc-Gal4>UAS-chRFP-Tub (green in G’–I’) and anti-Neurotactin (BP106; white in J–L). On all panels, parts of larval optic lobe neuropil (LON) are shown close to left margin (IOA inner optic anlage; OOA outer optic anlage). For abbreviations of compartments and fiber tracts see Table 1; for numbering of entry portals see Table 2. Bar: 20µm (D–F’); 50µm (G–I’)
Figure 11
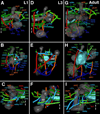
Figure 11. Digital 3D models of lineage-associated neuropil tracts in a single hemisphere of the L1 larval brain, (A–C), L3 larval brain (D–F) and adult brain (G–I)
Anterior view (upper row; A, D, G; medial to the left); medial view (intermediate row; B, E, H; anterior to the left); dorsal view (bottom row; C, F, I; medial to the right). Mushroom body and antennal lobe shown for reference (gray). Rendering of tracts follows color scheme used in Fig.4 (longitudinal tracts: blue; transverse tracts/commissures: green; ascending tracts: red; descending tracts: orange). The fan-shaped body primordium is rendered in light blue. Double-headed arrow indicates midline. Bars: 20µm (A–C); 25µm (D–F); 50µm (G–I)
Figure 12
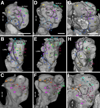
Figure 12. Entry portals of lineage-associated tracts (numbered hatched circles in the L1 larval brain (A–C), L3 larval brain (D–F), and adult brain (G–I)
Each panel shows volume rendering of anti-DN-cadherin-labeled (L1) or anti-bruchpilot (L3, adult) brain hemisphere, highlighting relief of neuropil surface. Anterior view (upper row; A, D, G; medial to the left); lateral view (intermediate row; B, E, H; anterior to the left); posterior view (bottom row; C, F, I; medial to the left). Double-headed arrow in (A) and all other panels indicates brain midline. Rendering of entry portals follows color scheme used to differentiate between groups of lineages in Fig.1 and Figs.5–10.

Similar articles

Cited by

References

    1. Bayraktar OA, Boone JQ, Drummond ML, Doe CQ. Drosophila type II neuroblast lineages keep Prospero levels low to generate large clones that contribute to the adult brain central complex. Neural Dev. 2010;5 - PMC - PubMed
    1. Bello BC, Izergina N, Caussinus E, Reichert H. Amplification of neural stem cell proliferation by intermediate progenitor cells in Drosophila brain development. Neural Dev. 2008;3 - PMC - PubMed
    1. Betschinger J, Mechtler K, Knoblich JA. Asymmetric segregation of the tumor suppressor brat regulates self-renewal in Drosophila neural stem cells. Cell. 2006;124:1241–1253. - PubMed
    1. Bieber AJ, Snow PM, Hortsch M, Patel NH, Jacobs JR, Traquina ZR, Schilling J, Goodman CS. Drosophila neuroglian: a member of the immunoglobulin superfamily with extensive homology to the vertebrate neural adhesion molecule L1. Cell. 1989;59:447–460. - PubMed
    1. Birkholz O, Rickert C, Nowak J, Coban IC, Technau GM. Bridging the gap between postembryonic cell lineages and identified embryonic neuroblasts in the ventral nerve cord of Drosophila melanogaster. Biol Open. 2015 Mar 27;4(4):420–434. - PMC - PubMed

Publication types

MeSH terms

LinkOut - more resources

  NODES
Association 3
INTERN 1
Note 2
Project 28
twitter 2