Age-related differences in lean mass, protein synthesis and skeletal muscle markers of proteolysis after bed rest and exercise rehabilitation
- PMID: 26173027
- PMCID: PMC4594296
- DOI: 10.1113/JP270699
Age-related differences in lean mass, protein synthesis and skeletal muscle markers of proteolysis after bed rest and exercise rehabilitation
Abstract
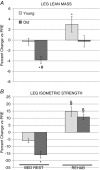
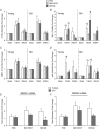
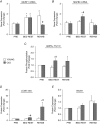
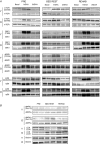
Bed rest-induced muscle loss and impaired muscle recovery may contribute to age-related sarcopenia. It is unknown if there are age-related differences in muscle mass and muscle anabolic and catabolic responses to bed rest. A secondary objective was to determine if rehabilitation could reverse bed rest responses. Nine older and fourteen young adults participated in a 5-day bed rest challenge (BED REST). This was followed by 8 weeks of high intensity resistance exercise (REHAB). Leg lean mass (via dual-energy X-ray absorptiometry; DXA) and strength were determined. Muscle biopsies were collected during a constant stable isotope infusion in the postabsorptive state and after essential amino acid (EAA) ingestion on three occasions: before (PRE), after bed rest and after rehabilitation. Samples were assessed for protein synthesis, mTORC1 signalling, REDD1/2 expression and molecular markers related to muscle proteolysis (MURF1, MAFBX, AMPKα, LC3II/I, Beclin1). We found that leg lean mass and strength decreased in older but not younger adults after bedrest (P < 0.05) and was restored after rehabilitation. EAA-induced mTORC1 signalling and protein synthesis increased before bed rest in both age groups (P < 0.05). Although both groups had blunted mTORC1 signalling, increased REDD2 and MURF1 mRNA after bedrest, only older adults had reduced EAA-induced protein synthesis rates and increased MAFBX mRNA, p-AMPKα and the LC3II/I ratio (P < 0.05). We conclude that older adults are more susceptible than young persons to muscle loss after short-term bed rest. This may be partially explained by a combined suppression of protein synthesis and a marginal increase in proteolytic markers. Finally, rehabilitation restored bed rest-induced deficits in lean mass and strength in older adults.
© 2015 The Authors. The Journal of Physiology © 2015 The Physiological Society.
Figures


Comment in
-
Age-dependent effects of bed rest in human skeletal muscle: exercise to the rescue.J Physiol. 2016 Jan 15;594(2):265-6. doi: 10.1113/JP271758. J Physiol. 2016. PMID: 26767889 Free PMC article. No abstract available.
Similar articles
-
Bed rest impairs skeletal muscle amino acid transporter expression, mTORC1 signaling, and protein synthesis in response to essential amino acids in older adults.Am J Physiol Endocrinol Metab. 2012 May 15;302(9):E1113-22. doi: 10.1152/ajpendo.00603.2011. Epub 2012 Feb 14. Am J Physiol Endocrinol Metab. 2012. PMID: 22338078 Free PMC article.
-
Neuromuscular Electrical Stimulation Combined with Protein Ingestion Preserves Thigh Muscle Mass But Not Muscle Function in Healthy Older Adults During 5 Days of Bed Rest.Rejuvenation Res. 2017 Dec;20(6):449-461. doi: 10.1089/rej.2017.1942. Epub 2017 Jun 19. Rejuvenation Res. 2017. PMID: 28482746 Free PMC article. Clinical Trial.
-
Aging-related effects of bed rest followed by eccentric exercise rehabilitation on skeletal muscle macrophages and insulin sensitivity.Exp Gerontol. 2018 Jul 1;107:37-49. doi: 10.1016/j.exger.2017.07.001. Epub 2017 Jul 10. Exp Gerontol. 2018. PMID: 28705613 Free PMC article.
-
Dietary proteins and amino acids in the control of the muscle mass during immobilization and aging: role of the MPS response.Amino Acids. 2017 May;49(5):811-820. doi: 10.1007/s00726-017-2390-9. Epub 2017 Feb 7. Amino Acids. 2017. PMID: 28175999 Review.
-
Skeletal muscle protein balance and metabolism in the elderly.Curr Aging Sci. 2011 Dec;4(3):260-8. doi: 10.2174/1874609811104030260. Curr Aging Sci. 2011. PMID: 21529326 Free PMC article. Review.
Cited by
-
Incident sarcopenia in hospitalized older people: A systematic review.PLoS One. 2023 Aug 2;18(8):e0289379. doi: 10.1371/journal.pone.0289379. eCollection 2023. PLoS One. 2023. PMID: 37531398 Free PMC article.
-
11C-L-methyl methionine dynamic PET/CT of skeletal muscle: response to protein supplementation compared to L-[ring 13C6] phenylalanine infusion with serial muscle biopsy.Ann Nucl Med. 2017 May;31(4):295-303. doi: 10.1007/s12149-017-1157-4. Epub 2017 Mar 4. Ann Nucl Med. 2017. PMID: 28260185 Free PMC article.
-
Physical Inactivity and Sedentarism during and after Admission with Community-Acquired Pneumonia and the Risk of Readmission and Mortality: A Prospective Cohort Study.J Clin Med. 2022 Oct 7;11(19):5923. doi: 10.3390/jcm11195923. J Clin Med. 2022. PMID: 36233789 Free PMC article.
-
Lower basal and postprandial muscle protein synthesis after 2 weeks single-leg immobilization in older men: No protective effect of anti-inflammatory medication.Physiol Rep. 2024 Feb;12(4):e15958. doi: 10.14814/phy2.15958. Physiol Rep. 2024. PMID: 38406891 Free PMC article.
-
Reduced Physical Activity Alters the Leucine-Stimulated Translatome in Aged Skeletal Muscle.J Gerontol A Biol Sci Med Sci. 2021 Nov 15;76(12):2112-2121. doi: 10.1093/gerona/glab077. J Gerontol A Biol Sci Med Sci. 2021. PMID: 33705535 Free PMC article.
References
-
- Berg HE, Tedner B. Tesch PA. Changes in lower limb muscle cross-sectional area and tissue fluid volume after transition from standing to supine. Acta Physiol Scand. 1993;148:379–385. - PubMed
-
- Breen L, Stokes KA, Churchward-Venne TA, Moore DR, Baker SK, Smith K, Atherton PJ. Phillips SM. Two weeks of reduced activity decreases leg lean mass and induces "anabolic resistance" of myofibrillar protein synthesis in healthy elderly. J Clin Endocrinol Metab. 2013;98:2604–2612. - PubMed
Publication types
MeSH terms
Substances
Grants and funding
LinkOut - more resources
Full Text Sources
Medical

