. 2015 Oct 15;24(20):5759-74.
doi: 10.1093/hmg/ddv296. Epub 2015 Jul 30.

A new model to study neurodegeneration in ataxia oculomotor apraxia type 2

Affiliations

A new model to study neurodegeneration in ataxia oculomotor apraxia type 2

Olivier J Becherel et al. Hum Mol Genet. .

Abstract

Ataxia oculomotor apraxia type 2 (AOA2) is a rare autosomal recessive cerebellar ataxia. Recent evidence suggests that the protein defective in this syndrome, senataxin (SETX), functions in RNA processing to protect the integrity of the genome. To date, only patient-derived lymphoblastoid cells, fibroblasts and SETX knockdown cells were available to investigate AOA2. Recent disruption of the Setx gene in mice did not lead to neurobehavioral defects or neurodegeneration, making it difficult to study the etiology of AOA2. To develop a more relevant neuronal model to study neurodegeneration in AOA2, we derived neural progenitors from a patient with AOA2 and a control by induced pluripotent stem cell (iPSC) reprogramming of fibroblasts. AOA2 iPSC and neural progenitors exhibit increased levels of oxidative damage, DNA double-strand breaks, increased DNA damage-induced cell death and R-loop accumulation. Genome-wide expression and weighted gene co-expression network analysis in these neural progenitors identified both previously reported and novel affected genes and cellular pathways associated with senataxin dysfunction and the pathophysiology of AOA2, providing further insight into the role of senataxin in regulating gene expression on a genome-wide scale. These data show that iPSCs can be generated from patients with the autosomal recessive ataxia, AOA2, differentiated into neurons, and that both cell types recapitulate the AOA2 cellular phenotype. This represents a novel and appropriate model system to investigate neurodegeneration in this syndrome.


Figures

Figure 1.
Figure 1.
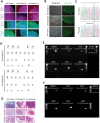
Characterization of AOA2 iPS cells. (A) Expression of pluripotency markers Oct4, Nanog, TRA-1-60 and TRA-1-81 in both control and AOA2 iPSC colonies. (B) Expression TRA-1-60 stem surface marker in control and AOA2 iPSCs. (C) mRNA sequencing confirmed the c.6109 A>G homozygous missense mutation in AOA2 iPSC. Chromatograms showing the wild-type (c.6109A) and mutated (c.6109G) sequences in controls and AOA2 iPSC lines, respectively (based on NCBI reference sequence NM_015046.5). (D) Normal karyotype was observed for both AOA2(C7) and AOA2(C8) iPS clones. (E) PCR analysis of genomic DNA revealed no amplicons following 36 rounds of PCR using IRES-anchored primers designed to amplify the reprogramming genes OCT4, SOX2, LIN28, KLF4 and c-MYC (plasmids used as positive controls). (F) RT–PCR analysis of RNA isolated from the AOA2 and control iPSC showed an absence of transgene expression (human fibroblasts transiently transfected with the reprogramming plasmids used as a positive control). (G) Teratoma formation in SCID mice following control and AOA2 iPSC injections. Tissue types from all three germ layers (endoderm, mesoderm and ectoderm) were observed indicating pluripotent tri-lineage differentiation.
Figure 2.
Figure 2.
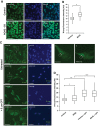
Oxidative stress and R-loop formation in AOA2 iPSC. (A) Increased levels of oxidative DNA damage in AOA2 iPSC revealed by anti-8-oxo-dG immunostaining. Nuclei were stained with DAPI. Scale bar, 50 µm. (B) Quantitation of 8-oxo-dG fluorescence intensity (AU, arbitrary units) in both control and AOA2 iPSC. Fluorescence intensity was measured for 100 cells per experiment from three technical replicates from one experiment (*P < 0.05, Student's t-test). (C) Detection of R-loop in control and AOA2 iPSC using the S9.6 antibody in untreated (basal levels) and CPT-treated cells. DAPI counterstained nuclei. Scale bar, 20 µm. (D) Quantitation of average R-loop fluorescence intensity (AU) in untreated and CPT-treated iPSc. *, ** and *** indicate P < 0.001, one-way ANOVA.
Figure 3.
Figure 3.
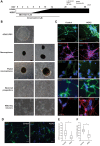
Directed differentiation of AOA2 iPSCs into neural progenitors. (A) Schematic representation of neural induction protocol involving stepwise addition of N2B27 neurobasal medium and small molecules SB431542 and dorsomorphin for the first 6 and 12 days, respectively. Neurospheres were generated on day 6 of induction and plated after day 12, giving rise to colonies with neuronal projections and morphologies that were assessed for a range of neuronal makers, including β-III tubulin, MAP2, nestin, doublecortin, NF160 and GFAP. (B) Bright field images showing the differentiation of AOA2 iPSC into neural progenitors and maturing neurons. (C) Immunostaining for neuronal markers as indicated in the time line in (A). DAPI counterstained the nuclei. For β-III tubulin, doublecortin and nestin, scale bar represents 50 μm. For NF160 and MAP2, scale bar corresponds to 20 μm. (D) GFAP immunostaining of control and AOA2 neural progenitors. DAPI counterstained nuclei. Scale bar, 50 μm. (E) Reduced GFAP staining intensity in AOA2 compared with controls. More than 100 GFAP-immunoreactive cells for each population were used to quantify the average fluorescence intensity (AU) (*P < 0.05, Student's t-test). (F) Percentage of GFAP-positive cells was determined after counting manually more than 500 cells from each cell population (*P < 0.05, Student's t-test).
Figure 4.
Figure 4.
DNA damage, oxidative stress and R-loops in AOA2 neural progenitors. (A) Control and AOA2 neural progenitors were immunostained for DNA damage using anti-γH2AX antibody. Scale bar, 20 μm. (B) Greater than 2-fold increase of γH2AX-positive cells in AOA2 neural progenitors compared with controls. About 200–400 cells were manually scored for the presence of γH2AX foci for control and AOA2 populations (*P < 0.05, Student's t-test). (C) Similar number of γH2AX foci per cell in both control and AOA2 neural progenitors (P = 0.34, Student's t-test). (D) DNA-damage-induced cell death after CPT (25 μm) and hydrogen peroxide (H2O2, 0.5 mm) treatments revealed a marked sensitivity of AOA2 neural progenitors to DNA-damaging agents and increased basal levels of apoptotic cells under normal growing conditions. (E) Immunostaining of control and AOA2 neural cultures with anti-8-oxo-dG antibody. DAPI stained nuclei. Scale bar, 20 µm. (F) A small but significant increase in oxidative stress as determined by 8-oxo-dG fluorescence intensity (AU) quantitation. More than 500 individual cells for each population were used for quantitation (*P < 0.05, Student's t-test). (G) Nitrotyrosine (Nitro-Y) staining of control and AOA2 neural progenitors. DAPI stained nuclei. Scale bar, 20 μm. (H) 4-HNE Michael adducts staining of control and AOA2 neural progenitors. DAPI stained nuclei. Scale bar, 20 μm. (I) 4-HNE fluorescence intensity quantitation for control and AOA2 neural progenitors (*P < 0.05, Student's t-test). (J) 4-HNE-Michael adducts fluorescence intensity distribution (x-axis) in control and AOA2 neural progenitors.
Figure 5.
Figure 5.
Accumulation of R-loops in AOA2 neural progenitors. (A) Detection of nucleolar and extranuclear R-loops in control and AOA2 neural progenitors using S9.6 antibody (14). DAPI stained nuclei. Scale, 20 µm. White arrows indicate nucleolar R-loops and green arrows indicate extranuclear R-loops. (B and C) Quantitation of nucleolar and extranuclear R-loop fluorescence intensity (AU) in neural progenitors (*P < 0.05, Student's t-test). A significant increase of R-loop formation in nucleoli and mitochondria was observed in AOA2 neural progenitors compared with controls (*P < 0.05, Student's t-test).
Figure 6.
Figure 6.
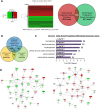
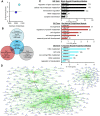
Identification of functionally relevant biological and molecular pathways related to senataxin function and disease in AOA2 neural progenitors. (A) Heat map for hierarchical clustering of differential gene expression in neural progenitors. Comparison of AOA2 versus control (P < 0.001, adjusted for false discovery rate) and number of significant genes up- and downregulated in AOA2 neural progenitors. (B) Overlap of the genes differentially expressed in neural progenitors with those previously published in AOA2 patient fibroblasts and fibroblasts transfected with mutant SETX (AOA2-specific genes) (10). (C) GO analysis of the AOA2 neural progenitor differentially expressed genes using DAVID (see Materials and Methods). (D) Examples of IPA-derived networks related to the central nervous system development and function and cellular growth and proliferation based on differential gene expression.
Figure 7.
Figure 7.
WGCNA in AOA2 neural progenitors shows preservation of SETX functional networks and pathways from AOA2 patient blood. (A) Preservation of the key WGCNA SETX modules from AOA2 patient peripheral blood (10) in the AOA2 neural progenitors. Results are plotted by number of module members versus preservation score (Z-summary) calculated using the preservation module function of the WGCNA software package. Z-summary score between 2 and 10 shows moderate preservation and scores less than 2 (dotted line) show weak or no preservation. Moderate preservation of the Turquoise_AOA2_blood module (representing SETX function) from AOA2 patient peripheral blood was observed in the AOA2 neural progenitors. The Blue_AOA2_blood module, representing the AOA2 transcriptional signature, is also weakly preserved. (B) Overlap of the genes in the key AOA2 neural progenitor modules (black, red and turquoise) with those in the Turquoise_AOA2_blood module is shown. (C) GO analysis of the AOA2 neural progenitors black, red and turquoise WGNCA modules. A list of key genes relevant to AOA2 and senataxin function from each module is shown in Supplementary Material, File S5. (D) The turquoise module identified by WGCNA in the AOA2 neural progenitors, which most closely correlates with the Turquoise_AOA2_blood module, is shown. For clarity, only the most highly connected module members are shown. Genes with the highest connectivity (i.e. hubs) are indicated in red.

Similar articles

Cited by

References

    1. Moreira M.C., Klur S., Watanabe M., Nemeth A.H., Le Ber I., Moniz J.C., Tranchant C., Aubourg P., Tazir M., Schols L. et al. (2004) Senataxin, the ortholog of a yeast RNA helicase, is mutant in ataxia-ocular apraxia 2. Nat. Genet., 36, 225–227. - PubMed
    1. Anheim M., Monga B., Fleury M., Charles P., Barbot C., Salih M., Delaunoy J.P., Fritsch M., Arning L., Synofzik M. et al. (2009) Ataxia with oculomotor apraxia type 2: clinical, biological and genotype/phenotype correlation study of a cohort of 90 patients. Brain, 132, 2688–2698. - PubMed
    1. Suraweera A., Becherel O.J., Chen P., Rundle N., Woods R., Nakamura J., Gatei M., Criscuolo C., Filla A., Chessa L. et al. (2007) Senataxin, defective in ataxia oculomotor apraxia type 2, is involved in the defense against oxidative DNA damage. J. Cell Biol., 177, 969–979. - PMC - PubMed
    1. Suraweera A., Lim Y., Woods R., Birrell G.W., Nasim T., Becherel O.J., Lavin M.F. (2009) Functional role for senataxin, defective in ataxia oculomotor apraxia type 2, in transcriptional regulation. Hum. Mol. Genet., 18, 3384–3396. - PubMed
    1. Skourti-Stathaki K., Proudfoot N.J., Gromak N. (2011) Human senataxin resolves RNA/DNA hybrids formed at transcriptional pause sites to promote Xrn2-dependent termination. Mol. Cell, 42, 794–805. - PMC - PubMed

Publication types

MeSH terms

Supplementary concepts

  NODES
Note 4
Project 1
twitter 2