. 2015 Dec 4;290(49):29603-16.
doi: 10.1074/jbc.M115.668889. Epub 2015 Oct 16.

Early Growth Response 1 (Egr-1) Regulates N-Methyl-d-aspartate Receptor (NMDAR)-dependent Transcription of PSD-95 and α-Amino-3-hydroxy-5-methyl-4-isoxazole Propionic Acid Receptor (AMPAR) Trafficking in Hippocampal Primary Neurons

Affiliations

Early Growth Response 1 (Egr-1) Regulates N-Methyl-d-aspartate Receptor (NMDAR)-dependent Transcription of PSD-95 and α-Amino-3-hydroxy-5-methyl-4-isoxazole Propionic Acid Receptor (AMPAR) Trafficking in Hippocampal Primary Neurons

Xike Qin et al. J Biol Chem. .

Abstract

The N-methyl-d-aspartate receptor (NMDAR) controls synaptic plasticity and memory function and is one of the major inducers of transcription factor Egr-1 in the hippocampus. However, how Egr-1 mediates the NMDAR signal in neurons has remained unclear. Here, we show that the hippocampus of mice lacking Egr-1 displays electrophysiology properties and ultrastructure that are similar to mice overexpressing PSD-95, a major scaffolding protein of postsynaptic density involved in synapse formation, synaptic plasticity, and synaptic _targeting of AMPA receptors (AMPARs), which mediate the vast majority of excitatory transmission in the CNS. We demonstrate that Egr-1 is a transcription repressor of the PSD-95 gene and is recruited to the PSD-95 promoter in response to NMDAR activation. Knockdown of Egr-1 in rat hippocampal primary neurons blocks NMDAR-induced PSD-95 down-regulation and AMPAR endocytosis. Likewise, overexpression of Egr-1 in rat hippocampal primary neurons causes reduction in PSD-95 protein level and promotes AMPAR endocytosis. Our data indicate that Egr-1 is involved in NMDAR-mediated PSD-95 down-regulation and AMPAR endocytosis, a process important in the expression of long term depression.

Keywords: PSD95; early growth response protein 1 (EGR1); endocytosis; neurobiology; transcription regulation; α-amino-3-hydroxy-5-methyl-4-isoxazole propionic acid receptor (AMPA receptor, AMPAR).


Figures

FIGURE 1.
FIGURE 1.
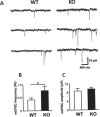
Enhanced mEPSC frequency in Egr-1 KO mice. A, sample traces recorded from WT (left panel) and Egr-1 KO mice (right panel). B, histogram shows higher mEPSC frequency in KO mice. Data are average from WT (n = 6) and KO (n = 6). *, p < 0.05. C, histogram shows no difference in mEPSC amplitude between WT and KO groups.
FIGURE 2.
FIGURE 2.
Organization of hippocampal presynaptic vesicle pool is altered in Egr-1 KO mice. A–C, representative EM images of stratum radiatum of CA1 hippocampus of WT (A) and Egr-1 KO (B) mice showing the organization of hippocampal presynaptic vesicle pools. The white arrowheads show presynaptic active zones where dense synaptic vesicles are shown. Black arrowheads show postsynaptic density zone. In KO mice, the number of presynaptic vesicles are higher and located closer to the active zone when compared with the WT. In addition, KO mice have more readily released vesicles docked to the active zone. C, quantification data are from WT and KO (three each). Twenty synapses from each animal were randomly selected and analyzed by Volocity software. Magnifications are ×23,000 (A and B) with corresponding scale bars of 100 nm each. *, p < 0.05 (n = 3) with respect to the WT.
FIGURE 3.
FIGURE 3.
Postsynaptic structure is altered in Egr-1 KO hippocampus. EM of WT (A) and KO (B) stratum radiatum of CA1 hippocampus shows the postsynaptic structures. White arrows show PSD, which is generally larger in the KO than in the WT. Scale bars, 500 nm each. C, quantification of synapses. Data represented are measurement from 20 randomly chosen synapses from each genotype. *, p < 0.01 (n = 3) with respect to the WT.
FIGURE 4.
FIGURE 4.
PSD-95 protein and mRNA levels are elevated in Egr-1 KO mouse hippocampi. Hippocampi of WT and KO mice (each 6 months old) were analyzed by Western blotting, qPCR, and immunohistochemistry. A, levels of synaptophysin and N-cadherin are not altered in Egr-1 KO mouse hippocampus. Hippocampal extracts of adult WT and Egr-1 KO mice (n = 3 in each group) were analyzed by quantitative Western blot analysis. Based on band intensities, relative amount of each protein was determined and compared. Upper panel is a representative Western blot. Lower panel indicates quantification data from three animals in each group. B, quantitative Western blot and qPCR analyses for PSD-95. Upper panel shows a representative Western blot. Middle panel is the result of Western blot quantification. Data presented are from three animals from each group. *, p < 0.05 (n = 3) with respect to WT. Lower panel shows quantitative RT-PCR analysis of PSD-95 mRNA (normalized to β-actin) in hippocampus of KO and WT genotypes (see Table 1 for primers used). The data are from three mice in each group. *, p < 0.04 with respect to WT. C, immunohistochemistry. Upper panel is a representative micrograph. Middle panels are corresponding insets at higher magnification. Immunohistochemical staining revealed widespread expression of PSD-95 in the hippocampal formation in both genotypes. Compared with WT, KO mice show higher PSD-95 immunostaining in CA1, CA2, and DG subfields. Scale bars, 100 μm in upper panel and 20 μm in middle panels. Lower panel shows analysis of PSD-95 immnoreactivity (optical density) in the CA1 and CA2 of hippocampus. Quantification of immunohistochemical staining was performed using the Spectrum Analysis algorithm package and ImageScope analysis software (version 11.2, Aperio Technologies). A rectangular region of interest, 25 μm2 in size, was defined. Immunoreactivity value for each region of interest was obtained. The immunoreactivity within each regions of interest in each section was averaged to generate a mean immunoreactive value for each animal. Data were averaged from three mice each with four regions (n = 12) for each genotype and are expressed as the fold of WT. ***, p < 0.001 (n = 3) with respect to WT.
FIGURE 5.
FIGURE 5.
Overexpression of Egr-1 suppresses PSD-95 levels in rat hippocampal primary neurons. Rat hippocampal neurons in culture for 14 days were infected with Ln-Egr-1 of Ln vector. After 72 h, infected neurons were analyzed by immunocytochemistry, Western blotting, and qPCR. A, immunocytochemistry. Representative Confocal images showing GFP (green) and PSD-95 (red) immunostaining. Right-hand panel shows corresponding inset in higher magnification. Quantification of PSD-95 puncta (top right) was done from 15 randomly chosen infected neurons from three different cultures in each group along at least 30 μm of each neurite. *, p < 0.02 (n = 3) with respect to Ln vector-infected control. B, Western blot analysis of rat hippocampal extract using antibody against PSD-95, Myc-Egr-1 (anti-Myc), and tubulin (loading control). Based on the band intensities, the relative amounts of different proteins were calculated. Values are from three different cultures. *, p < 0.05 (n = 3) with respect to Ln vector-infected control. C, qPCR was performed to determine relative mRNA of PSD-95 and Egr-1 in infected neurons. Data are from three different cultures. *, p < 0.03 (n = 3), and ***, p < 0.0001 (n = 3), with respect to Ln vector-infected neurons.
FIGURE 6.
FIGURE 6.
Egr-1 binds to PSD-95 promoter. Luciferase and ChiP assays were performed to evaluate the binding of Egr-1 onto the PSD-95 promoter. A, luciferase assay. Schematic diagram of the three constructs used to identify the Egr-1-binding site on PSD-95 promoter by luciferase activity assay. Putative Egr-1-binding site and mutations used to disrupt the binding sequence are shown. These constructs were co-transfected with luciferase reporter plasmid and Egr-1 or vector control in COS-7 cells, and luciferase activity was assayed and quantified. Bar graph in the lower panel represents results from three independent experiments. *, p < 0.05 (n = 3) with respect to vector and fragment 1-transfected cells. B, ChiP assay. ChiP assay was performed to confirm the Egr-1-binding site identified above. COS-7 cells were treated with PMA to induce Egr-1 expression for 1 h and then subjected to ChiP assay using anti-Egr-1 antibody or IgG control. Upper panel shows kinetics of Egr-1 induction in these cells. Lower panel shows the result of ChiP assay using primer specific for the above PSD-95 site. The values are the average of three independent determinations. ***, p < 0.001 (n = 3) with respect to IgG control.
FIGURE 7.
FIGURE 7.
NMDA exposure recruits Egr-1 onto PSD-95 promoter in rat hippocampal cultured neurons. A, ChiP assay using antibody against Egr-1 was performed on neurons treated with NMDA or vehicle to monitor the recruitment of Egr-1 onto the PSD-95 promoter. Treated cultures were immunoprecipitated with anti-Egr-1 or IgG control. PSD-95 promoter was amplified by qPCR using primers against the Egr-1-binding site identified in Fig. 6. GAPDH DNA level was monitored as the internal control. Bar graphs were generated using qPCR data from three independent experiments. *, p < 0.05 (n = 3) with respect to corresponding IgG control. B, comparison of PSD-95 promoter amplification in vehicle- and NMDA-treated neurons. To compare between the two groups, qPCR values obtained from IgG from A were subtracted from the corresponding values from anti-Egr-1. Resulting values were used to generate the graph. Values are from three determinations and are presented as the fold of vehicle-treated controls. ***, p < 0.0001 (n = 3) with respect to vehicle-treated neurons.
FIGURE 8.
FIGURE 8.
Knockdown of Egr-1 inhibits NMDA-induced down-regulation of PSD-95 and surface expression of AMPARs in mouse hippocampal cultured neurons. Hippocampal primary neurons were infected with Ln-shRNA-Egr-1 or Ln-shRNA-ctl. Infected cultures were treated with NMDA or vehicle and analyzed by Western blotting for total proteins and biotinylation assay for surface receptors. Based on blot band intensities, various proteins were quantified. A, construct design and in vitro testing of lenti-shRNA constructs. Upper panel is a diagrammatic representation of mouse siEgr-1 _targeting sequence locations. Lower panel shows confirmation by Western blot analysis of silencing of endogenous Egr-1 in mouse 3T3L1 cell line. Compared with control shRNA, all three shRNAs against Egr-1 down-regulate endogenous Egr-1. Sh-3 was most effective and hence was used to silence Egr-1 in hippocampal primary neurons. *, p < 0.05 (n = 3), and **, p < 0.01 (n = 3), with respect to Ln-shRNA-ctl-infected cells. B, knockdown of Egr-1 inhibits NMDA-induced down-regulation of PSD-95. Upper panel is a representative Western blot. Lower panels show quantification data. Values are from three different experiments and are expressed as the % of Ln-shRNA-ctl- and vehicle-treated neurons. *, p < 0.05 (n = 3) with respect to Ln-shRNA-ctl-infected and vehicle-treated neurons. **, p < 0.01 (n = 3) with respect to Ln-shRNA-ctl-infected and NMDA-treated neurons. C, knockdown of Egr-1 inhibits NMDA-induced surface expression of AMPAR GluA2. Neurons were analyzed for expression of total and surface GluA2 and NMDAR N2A by Western blotting and biotinylation assay, respectively. The upper panel shows representative Western blots. Lower panel represents quantifications from three different cultures. Quantification of each receptor was performed as described under “Materials and Methods.” *, p < 0.05 (n = 3) with respect to Ln-shRNA-ctl- and vehicle-treated neurons. **, p < 0.05 (n = 3) with respect to Ln-shRNA-ctl- and NMDA-treated neurons. D, overexpression of Egr-1 rescues shRNA-Egr-1-induced surface accumulation of GluA2. Neurons co-infected with Ln-shRNA-Egr-1 and Ln-Egr-1 were analyzed by biotinylation assay. *, p < 0.05 (n = 3) with respect to Ln vector control.
FIGURE 9.
FIGURE 9.
Knockdown of Egr-1 blocks NMDA-induced AMPAR endocytosis in mouse hippocampal neurons in culture. Neurons infected with Ln-shRNA-ctl or Ln-shRNA-Egr-1 were treated with NMDA or vehicle and subjected to antibody feeding protocol to analyze GluA2 endocytosis by confocal microscopy. Images were captured, and GluA2 puncta were quantified. Based on puncta numbers, relative distributions and relative endocytosis values were determined. A, representative micrographs of neurons infected and treated as indicated showing GFP, surface GluA2, and internal GluA2. In Ln-shRNA-ctl-infected neurons, GluA2 is found on both surface and internal pool. When these neurons are treated with NMDA, the number of surface GluA2 is significantly reduced with a concomitant increase in the internal pool. In shRNA-Egr-1-infected and vehicle-treated neurons, more GluA2s are on the surface than in the internal pool; and they remain on the surface when neurons are treated with NMDA. Thus, knockdown of Egr-1 blocks NMDA-induced GluA2 endocytosis. B, representative micrographs of dendrites of infected neurons in higher magnifications. C, relative distribution. Fifteen GFP-positive (hence infected) neurons were randomly chosen from three different cultures from each group. Number of puncta along 30 μm of dendrite in each neuron was scored using Volocity software. The average number of puncta within 10 μm of the dendrite from three independent experiments were 3.9 ± 0.3 (surface) and 2.7 ± 0.5 (internal) in Ln-shRNA-ctl-infected and vehicle-treated neurons, 1.4 ± 0.25 (surface) and 5.8 ± 1.5 (internal) in Ln-shRNA-ctl- and NMDA-treated neurons, 4.5 ± 0.4 (surface) and 1.3 ± 0.2 (internal) in Ln-shRNA-Egr-1 infected and vehicle-treated neurons, and 3.8 ± 0.4 (surface) and 1.6 ± 0.3 (internal) in NMDA-treated neurons. Based on these numbers, relative distribution values were determined. The relative distribution value is the number of puncta in a fraction (surface or internal) of a group divided by the total (sum of the puncta in the two fractions (surface and internal)) of that group. Values are expresses as the % of the total. D, relative GluA2 endocytosis. To determine the relative amount of NMDA-induced GluA2 endocytosis, the % value of surface GluA2 from NMDA-treated neurons from panel C of a group was subtracted from the corresponding % value of surface GluA2 from vehicle-treated neurons of that group. Resulting value is then expressed as the % of the total GluA2 (% value of surface GluA2 in corresponding vehicle-treated neurons of that group). **, p < 0.005 (n = 3) with respect to Ln-shRNA-ctl-infected cells.
FIGURE 10.
FIGURE 10.
Overexpression of Egr-1 in rat hippocampal cultured neurons promotes AMPAR trafficking. A and B, overexpression of Egr-1 reduces levels of PSD-95 and surface GluA2. Rat hippocampal primary neurons in culture were infected with Ln-Egr-1 or Ln vector and analyzed by Western blot for proteins and biotinylation assay for surface receptors. A, Western blot. Proteins were separated and analyzed using indicated antibodies. Based on blot bands, the relative amounts of protein in each lane were quantified. Values are the average from three independent experiments. *, p < 0.05 (n = 3) with respect to Ln vector-infected neurons. B, biotinylation assay. Biotinylated samples were Western-blotted, and bands were quantified as in Fig. 7. Values are from three independent determinations from three different cultures. **, p < 0.005 (n = 3) with respect to Ln vector-infected cultures. C–F, overexpression of Egr-1 in rat hippocampal primary neurons promotes AMPAR endocytosis and reduced surface AMPAR levels. Neurons infected with Ln-Egr-1 or Ln vector were subjected to antibody feeding protocol for surface and internal GluA2 receptors. Images were captured by confocal microscope and quantified for surface and internal GluA2 as in Fig. 9C. Based on the numbers, relative distribution and relative endocytosis values were determined. C, representative micrographs showing infected neurons (GFP), surface GluA2, and internal GluA2. D, representative micrographs of dendrites of infected neurons under higher magnification. Fifteen GFP-positive neurons were randomly chosen from three different cultures, and the number of puncta along 30–40 μm of each dendrite was determined by Volocity software. The average number of surface and internal puncta within the 20 μm of dendrites from three independent experiments were 10.8 ± 3.3 and 4.5 ± 1.3, respectively, in Ln vector-infected neurons and 6.4 ± 2.2 and 10.3 ± 1.6, respectively, in Ln-Egr-1-infected neurons. Based on these numbers, relative distribution and relative endocytosis values were calculated. E, relative distribution. To calculate the relative distribution of GluA2 between the surface and internal portion of a group, the number of puncta in a fraction (surface or internal) was divided by the total (sum of the number of puncta in the two fractions of that group). The resulting value is expressed as the % of the total. F, relative endocytosis. The relative GluA2 endocytosis is the % value of internal GluA2 in each group from E and is expressed as the fold of Ln vector control. Values are from three determinations. **, p < 0.05 (n = 3) with respect to Ln vector-infected neurons.

Similar articles

Cited by

References

    1. Alvarez V. A., and Sabatini B. L. (2007) Anatomical and physiological plasticity of dendritic spines. Annu. Rev. Neurosci. 30, 79–97 - PubMed
    1. Chen X., Vinade L., Leapman R. D., Petersen J. D., Nakagawa T., Phillips T. M., Sheng M., and Reese T. S. (2005) Mass of the postsynaptic density and enumeration of three key molecules. Proc. Natl. Acad. Sci. U.S.A. 102, 11551–11556 - PMC - PubMed
    1. Lüscher C., Nicoll R. A., Malenka R. C., and Muller D. (2000) Synaptic plasticity and dynamic modulation of the postsynaptic membrane. Nat. Neurosci. 3, 545–550 - PubMed
    1. Kennedy M. B. (2000) Signal-processing machines at the postsynaptic density. Science 290, 750–754 - PubMed
    1. Sheng M., and Kim M. J. (2002) Postsynaptic signaling and plasticity mechanisms. Science 298, 776–780 - PubMed

Publication types

MeSH terms

  NODES
INTERN 19
twitter 2