Dynamic changes in histone modifications precede de novo DNA methylation in oocytes
- PMID: 26584620
- PMCID: PMC4691949
- DOI: 10.1101/gad.271353.115
Dynamic changes in histone modifications precede de novo DNA methylation in oocytes
Abstract
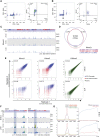
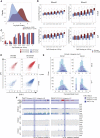
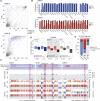
Erasure and subsequent reinstatement of DNA methylation in the germline, especially at imprinted CpG islands (CGIs), is crucial to embryogenesis in mammals. The mechanisms underlying DNA methylation establishment remain poorly understood, but a number of post-translational modifications of histones are implicated in antagonizing or recruiting the de novo DNA methylation complex. In mouse oogenesis, DNA methylation establishment occurs on a largely unmethylated genome and in nondividing cells, making it a highly informative model for examining how histone modifications can shape the DNA methylome. Using a chromatin immunoprecipitation (ChIP) and genome-wide sequencing (ChIP-seq) protocol optimized for low cell numbers and novel techniques for isolating primary and growing oocytes, profiles were generated for histone modifications implicated in promoting or inhibiting DNA methylation. CGIs destined for DNA methylation show reduced protective H3K4 dimethylation (H3K4me2) and trimethylation (H3K4me3) in both primary and growing oocytes, while permissive H3K36me3 increases specifically at these CGIs in growing oocytes. Methylome profiling of oocytes deficient in H3K4 demethylase KDM1A or KDM1B indicated that removal of H3K4 methylation is necessary for proper methylation establishment at CGIs. This work represents the first systematic study performing ChIP-seq in oocytes and shows that histone remodeling in the mammalian oocyte helps direct de novo DNA methylation events.
Keywords: ChIP-seq; DNA methylation; genomic imprinting; histone modifications; oocytes.
© 2015 Stewart et al.; Published by Cold Spring Harbor Laboratory Press.
Figures


Comment in
-
Epigenetics: Making marks in oocyte development.Nat Rev Genet. 2016 Feb;17(2):68-9. doi: 10.1038/nrg.2015.22. Epub 2015 Dec 7. Nat Rev Genet. 2016. PMID: 26639569 No abstract available.
Similar articles
-
Transcription and chromatin determinants of de novo DNA methylation timing in oocytes.Epigenetics Chromatin. 2017 May 12;10:25. doi: 10.1186/s13072-017-0133-5. eCollection 2017. Epigenetics Chromatin. 2017. PMID: 28507606 Free PMC article.
-
KDM1B is a histone H3K4 demethylase required to establish maternal genomic imprints.Nature. 2009 Sep 17;461(7262):415-8. doi: 10.1038/nature08315. Epub 2009 Sep 2. Nature. 2009. PMID: 19727073
-
Deep sequencing and de novo assembly of the mouse oocyte transcriptome define the contribution of transcription to the DNA methylation landscape.Genome Biol. 2015 Sep 25;16:209. doi: 10.1186/s13059-015-0769-z. Genome Biol. 2015. PMID: 26408185 Free PMC article.
-
Understanding the interplay between CpG island-associated gene promoters and H3K4 methylation.Biochim Biophys Acta Gene Regul Mech. 2020 Aug;1863(8):194567. doi: 10.1016/j.bbagrm.2020.194567. Epub 2020 Apr 29. Biochim Biophys Acta Gene Regul Mech. 2020. PMID: 32360393 Free PMC article. Review.
-
Establishment and functions of DNA methylation in the germline.Epigenomics. 2016 Oct;8(10):1399-1413. doi: 10.2217/epi-2016-0056. Epub 2016 Sep 23. Epigenomics. 2016. PMID: 27659720 Free PMC article. Review.
Cited by
-
Desiccation and supra-zero temperature storage of cat germinal vesicles lead to less structural damage and similar epigenetic alterations compared to cryopreservation.Mol Reprod Dev. 2019 Dec;86(12):1822-1831. doi: 10.1002/mrd.23276. Epub 2019 Sep 23. Mol Reprod Dev. 2019. PMID: 31549479 Free PMC article.
-
Genome-wide assessment of DNA methylation in mouse oocytes reveals effects associated with in vitro growth, superovulation, and sexual maturity.Clin Epigenetics. 2019 Dec 19;11(1):197. doi: 10.1186/s13148-019-0794-y. Clin Epigenetics. 2019. PMID: 31856890 Free PMC article.
-
Transient Polycomb activity represses developmental genes in growing oocytes.Clin Epigenetics. 2022 Dec 21;14(1):183. doi: 10.1186/s13148-022-01400-w. Clin Epigenetics. 2022. PMID: 36544159 Free PMC article.
-
Evolution of imprinting via lineage-specific insertion of retroviral promoters.Nat Commun. 2019 Dec 12;10(1):5674. doi: 10.1038/s41467-019-13662-9. Nat Commun. 2019. PMID: 31831741 Free PMC article.
-
Enhancer-driven alternative promoters of imprinted genes.PLoS One. 2018 Nov 30;13(11):e0208421. doi: 10.1371/journal.pone.0208421. eCollection 2018. PLoS One. 2018. PMID: 30500864 Free PMC article.
References
-
- Baubec T, Colombo DF, Wirbelauer C, Schmidt J, Burger L, Krebs AR, Akalin A, Schübeler D. 2015. Genomic profiling of DNA methyltransferases reveals a role for DNMT3B in genic methylation. Nature 520: 243–247. - PubMed
-
- Bourc'his D, Xu GL, Lin CS, Bollman B, Bestor TH. 2001. Dnmt3L and the establishment of maternal genomic imprints. Science 294: 2536–2539. - PubMed
Publication types
MeSH terms
Substances
Associated data
- Actions
- Actions
Grants and funding
LinkOut - more resources
Full Text Sources
Other Literature Sources
