A DNMT3A2-HDAC2 Complex Is Essential for Genomic Imprinting and Genome Integrity in Mouse Oocytes
- PMID: 26586441
- PMCID: PMC4662907
- DOI: 10.1016/j.celrep.2015.10.031
A DNMT3A2-HDAC2 Complex Is Essential for Genomic Imprinting and Genome Integrity in Mouse Oocytes
Abstract
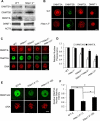
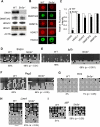
Maternal genomic imprints are established during oogenesis. Histone deacetylases (HDACs) 1 and 2 are required for oocyte development in mouse, but their role in genomic imprinting is unknown. We find that Hdac1:Hdac2(-/-) double-mutant growing oocytes exhibit global DNA hypomethylation and fail to establish imprinting marks for Igf2r, Peg3, and Srnpn. Global hypomethylation correlates with increased retrotransposon expression and double-strand DNA breaks. Nuclear-associated DNMT3A2 is reduced in double-mutant oocytes, and injecting these oocytes with Hdac2 partially restores DNMT3A2 nuclear staining. DNMT3A2 co-immunoprecipitates with HDAC2 in mouse embryonic stem cells. Partial loss of nuclear DNMT3A2 and HDAC2 occurs in Sin3a(-/-) oocytes, which exhibit decreased DNA methylation of imprinting control regions for Igf2r and Srnpn, but not Peg3. These results suggest seminal roles of HDAC1/2 in establishing maternal genomic imprints and maintaining genomic integrity in oocytes mediated in part through a SIN3A complex that interacts with DNMT3A2.
Copyright © 2015 The Authors. Published by Elsevier Inc. All rights reserved.
Figures


Similar articles
-
HDAC1 and HDAC2 in mouse oocytes and preimplantation embryos: Specificity versus compensation.Cell Death Differ. 2016 Jul;23(7):1119-27. doi: 10.1038/cdd.2016.31. Epub 2016 Apr 15. Cell Death Differ. 2016. PMID: 27082454 Free PMC article. Review.
-
Compensatory functions of histone deacetylase 1 (HDAC1) and HDAC2 regulate transcription and apoptosis during mouse oocyte development.Proc Natl Acad Sci U S A. 2012 Feb 21;109(8):E481-9. doi: 10.1073/pnas.1118403109. Epub 2012 Jan 5. Proc Natl Acad Sci U S A. 2012. PMID: 22223663 Free PMC article.
-
Forced expression of DNA methyltransferases during oocyte growth accelerates the establishment of methylation imprints but not functional genomic imprinting.Hum Mol Genet. 2014 Jul 15;23(14):3853-64. doi: 10.1093/hmg/ddu100. Epub 2014 Mar 5. Hum Mol Genet. 2014. PMID: 24599402 Free PMC article.
-
Contribution of intragenic DNA methylation in mouse gametic DNA methylomes to establish oocyte-specific heritable marks.PLoS Genet. 2012 Jan;8(1):e1002440. doi: 10.1371/journal.pgen.1002440. Epub 2012 Jan 5. PLoS Genet. 2012. PMID: 22242016 Free PMC article.
-
[The role of histone deacetylases 1/2 in regulating murine oogenesis].Sheng Li Xue Bao. 2021 Jun 25;73(3):527-534. Sheng Li Xue Bao. 2021. PMID: 34230954 Review. Chinese.
Cited by
-
Evolution of the Short Form of DNMT3A, DNMT3A2, Occurred in the Common Ancestor of Mammals.Genome Biol Evol. 2022 Jul 2;14(7):evac094. doi: 10.1093/gbe/evac094. Genome Biol Evol. 2022. PMID: 35749276 Free PMC article.
-
DNA Methylation Reprogramming during Mammalian Development.Genes (Basel). 2019 Mar 29;10(4):257. doi: 10.3390/genes10040257. Genes (Basel). 2019. PMID: 30934924 Free PMC article. Review.
-
Single-cell multi-omics profiling reveals key regulatory mechanisms that poise germinal vesicle oocytes for maturation in pigs.Cell Mol Life Sci. 2023 Jul 22;80(8):222. doi: 10.1007/s00018-023-04873-x. Cell Mol Life Sci. 2023. PMID: 37480402 Free PMC article.
-
Dysregulation of Epigenetic Mechanisms of Gene Expression in the Pathologies of Hyperhomocysteinemia.Int J Mol Sci. 2019 Jun 27;20(13):3140. doi: 10.3390/ijms20133140. Int J Mol Sci. 2019. PMID: 31252610 Free PMC article. Review.
-
The conserved DNMT1-dependent methylation regions in human cells are vulnerable to neurotoxicant rotenone exposure.Epigenetics Chromatin. 2020 Mar 16;13(1):17. doi: 10.1186/s13072-020-00338-8. Epigenetics Chromatin. 2020. PMID: 32178731 Free PMC article.
References
-
- Bao S, Obata Y, Carroll J, Domeki I, Kono T. Epigenetic modifications necessary for normal development are established during oocyte growth in mice. Biol Reprod. 2000;62:616–621. - PubMed
-
- Bhaumik SR, Smith E, Shilatifard A. Covalent modifications of histones during development and disease pathogenesis. Nat Struct Mol Biol. 2007;14:1008–1016. - PubMed
-
- Bourc'his D, Xu GL, Lin CS, Bollman B, Bestor TH. Dnmt3L and the establishment of maternal genomic imprints. Science. 2001;294:2536–2539. - PubMed
-
- Cedar H, Bergman Y. Linking DNA methylation and histone modification: patterns and paradigms. Nat Rev Genet. 2009;10:295–304. - PubMed
-
- Chatot CL, Ziomek CA, Bavister BD, Lewis JL, Torres I. An improved culture medium supports development of random-bred 1-cell mouse embryos in vitro. J Reprod Fertil. 1989;86:679–688. - PubMed
Publication types
MeSH terms
Substances
Grants and funding
LinkOut - more resources
Full Text Sources
Other Literature Sources
Molecular Biology Databases
Miscellaneous

