. 2016 Feb 29;212(5):577-90.
doi: 10.1083/jcb.201503075. Epub 2016 Feb 22.

NBR1 enables autophagy-dependent focal adhesion turnover

Affiliations

NBR1 enables autophagy-dependent focal adhesion turnover

Candia M Kenific et al. J Cell Biol. .

Abstract

Autophagy is a catabolic pathway involving the sequestration of cellular contents into a double-membrane vesicle, the autophagosome. Although recent studies have demonstrated that autophagy supports cell migration, the underlying mechanisms remain unknown. Using live-cell imaging, we uncover that autophagy promotes optimal migratory rate and facilitates the dynamic assembly and disassembly of cell-matrix focal adhesions (FAs), which is essential for efficient motility. Additionally, our studies reveal that autophagosomes associate with FAs primarily during disassembly, suggesting autophagy locally facilitates the destabilization of cell-matrix contact sites. Furthermore, we identify the selective autophagy cargo receptor neighbor of BRCA1 (NBR1) as a key mediator of autophagy-dependent FA remodeling. NBR1 depletion impairs FA turnover and decreases _targeting of autophagosomes to FAs, whereas ectopic expression of autophagy-competent, but not autophagy-defective, NBR1 enhances FA disassembly and reduces FA lifetime during migration. Our findings provide mechanistic insight into how autophagy promotes migration by revealing a requirement for NBR1-mediated selective autophagy in enabling FA disassembly in motile cells.


Figures

Figure 1.
Figure 1.
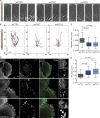
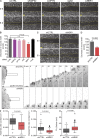
Impaired migration rate and increased FA size in autophagy-deficient cells. (A) Representative phase-contrast microscopy time-lapse sequences of single cells expressing shControl (CTRL; left), shATG7 (middle), or shATG12 (right) tracked over 3 h after wounding. Elapsed time (h) in top left of images. Bars, 10 µm. These images correspond to Video 1. (B) Migration paths of individual shCTRL (left), shATG7 (middle), or shATG12 (right) cells showing total distance traveled over 3 h. Cell position over time was used to generate paths and was determined by manually tracking cell nucleoli in each frame over the course of the time lapse. n = 10 representative cells shown per condition, and each colored track represents an independent cell. The starting position for each cell was normalized to 0 µm, 0 µm on the x, y axes. (C) Quantification of migration rate of individual tracked cells determined as total distance traveled divided by the total time of migration (d/tft0). Data presented as median (line), first and third quartile (box), and whiskers extend to ±1.5 times the interquartile range. Individual data points outside of this range are shown. n = 155 cells for shCTRL, n = 121 cells for shATG7, and n = 115 cells for shATG12, pooled from three independent experiments.P-values calculated using a nonparametric Kruskall-Wallis test followed by Dunn post-hoc test. (D) Representative immunofluorescence images of migrating wound edge cells expressing shCTRL (top), shATG7 (middle), or shATG12 (bottom) stained for endogenous F-actin (green) and paxillin (magenta) to mark FAs. Right panels show enlarged insets of boxed region in merged images. Bars, 5 µm. Insets are magnified 3.7-fold. (E) Quantification of the area of leading edge FAs in migrating wound edge cells determined by manually outlining anti-paxillin-labeled FAs. Data presented as median (line), first and third quartile (box), and whiskers extend to ±1.5 times the interquartile range. n = 713 FAs for shCTRL, n = 511 FAs for shATG7, and n = 430 FAs for shATG12, pooled from two independent experiments. P-values calculated using a nonparametric Kruskall-Wallis test followed by Dunn post-hoc test. n.s., not significant.
Figure 2.
Figure 2.
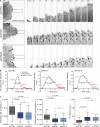
Autophagy promotes FA turnover in migrating cells. (A) Spinning disk confocal microscopy time-lapse sequences of migrating cells expressing paxillin-mCherry (black) to monitor FA dynamics. Left panels show representative cells expressing shCTRL (top), shATG7 (middle), or shATG12 (bottom). Image sequences of boxed regions have been rotated such that the cell edge with dynamic FAs is moving upward vertically. Elapsed time (min) shown in top left. Bars, 5 µm. Insets are magnified twofold. These images correspond to Videos 2 and 3. (B) Example plots of paxillin-mCherry fluorescence intensity (y axis) over time (x axis) for shCTRL (left), shATG7 (middle), and shATG12 (right) cells used for calculating FA turnover parameters in C. Plots generated by manually tracking individual FAs over time, and each data point is a three-frame running mean of intensity value. The green line represents FA assembly fitted with a logistic function, and the red line represents FA disassembly fitted with an exponential decay function. The lifetime is the time spent above half-maximum fluorescence intensity (double arrow). The values of each parameter are indicated for the specific curves shown (assembly rate constant in green, disassembly rate constant in red, and lifetime in black). (C) Quantification of assembly rate constants (left), disassembly rate constants (middle), and lifetime (right) for FAs in cells expressing shCTRL, shATG7, or shATG12. Data presented as median (line), first and third quartile (box), and whiskers extend to ±1.5 times the interquartile range. Individual data points outside of this range are shown. n = 64 FAs for shCTRL, n = 62 FAs for shATG7, and n = 51 FAs for shATG12, pooled from four independent experiments. P-values calculated using a nonparametric Kruskall-Wallis test followed by Dunn post-hoc test. n.s., not significant.
Figure 3.
Figure 3.
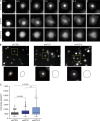
Autophagy inhibition results in enhanced cell spreading. (A) Spinning disk confocal microscopy time-lapse sequences of cells expressing ZsGreen during spreading after replating. Representative shCTRL (top), shATG7 (middle), or shATG12 (bottom) cells shown over a 3-h time course. Elapsed time (h) indicated in top left of images. Bars, 10 µm. (B) Representative images of ZsGreen-expressing cells fixed 1 h after replating used for quantification of cell area in C. Whole field images shown with enlarged boxed insets of individual cells at bottom left. Tracing of individual cell in inset shown at bottom right. Bars, 50 µm. Insets are magnified 2.4-fold. (C) Quantification of area of cells fixed 1 h after replating. Area determined by manually outlining individual ZsGreen-expressing cell borders. Data presented as median (line), first and third quartile (box), and whiskers extend to ±1.5 times the interquartile range. Individual data points outside of this range are shown. n = 315 cells for shCTRL, n = 351 cells for shATG7, and n = 306 cells for shATG12, pooled from three independent experiments. P-values were calculated using a nonparametric Kruskall-Wallis test followed by Dunn post-hoc test. n.s., not significant.
Figure 4.
Figure 4.
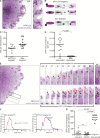
Autophagosomes associate with dynamic FAs during disassembly. (A) Spinning disk confocal microscopy of a migrating cell expressing GFP-LC3 (black) to label autophagosomes and paxillin-mCherry (magenta) to label FAs. Left panel shows maximum intensity projection (MIP) of a cell over 21 min, illustrating multiple associations between autophagosomes and FAs. Boxed inset areas are enlarged in right panel. Bar, 5 µm. Insets are magnified twofold. (B) Criteria for distinguishing GFP-LC3–_targeted FAs versus non_targeted FAs. Left illustration depicts representations of _targeted FAs (top and middle) and non_targeted FAs (bottom). Right images are examples of _targeted and non_targeted FAs. Bar, 0.5 µm. (C) Quantification of the percentage of dynamic leading edge FAs per cell _targeted by autophagosomes. FAs were randomly chosen independent of the GFP channel and then manually tracked from their appearance to disappearance for evidence of direct contact by GFP-LC3 vesicles. Scatter plot shows individual single cells (n = 12 total cells) and median (line), representing 129 total FAs analyzed from two independent experiments. (D) Analysis of GFP-LC3 vesicles in FA areas and non-FA areas at the leading edge of migrating cells. The total number of vesicles at FAs or in non-FA areas was counted and normalized to the total area for FA or non-FA regions, respectively. Scatter plot shows individual single cells (n = 12 total cells) and mean (line), representing 196 total leading edge GFP-LC3 vesicles analyzed from two independent experiments. P-value determined using unpaired t test. (E) Spinning disk confocal microscopy time-lapse sequences of representative _targeted (box with dotted border, bottom) and non_targeted (box with solid border, top) FAs. Insets rotated such that leading edge is moving upward vertically. Arrows track single FAs over time, with autophagosome _targeting indicated by arrowheads. Elapsed time (min) shown in top left of images. Right-most panels show MIP for each FA (arrow) shown in the corresponding time-lapse sequence. Bar, 5 µm. Insets are magnified 1.5-fold. (F) Representative paxillin-mCherry fluorescence intensity (y axis) plots over time (x axis) for the FAs shown in E. Frames in which GFP-LC3 was in direct contact with FAs are indicated by black data points and bracketing (right plot). (G) Temporal analysis of GFP-LC3 _targeting to FAs. The phase during which GFP-LC3 associated with FAs was determined by counting the total number of GFP-LC3 _targeting events in C and determining when during FA turnover each event occurred; if FAs were _targeted multiple times during their lifetime, each event was independently counted. Scatter plot shows individual cells (n = 12 total cells) and median (line), representing 114 total _targeting events analyzed from two independent experiments. P-values were calculated using a nonparametric Kruskall-Wallis test followed by Dunn post-hoc test. n.s., not significant. Images in this figure correspond to Videos 4–6.
Figure 5.
Figure 5.
NBR1 facilitates cell migration and FA turnover. (A) Representative phase-contrast microscopy images at time of wounding (0 h) and 6 h after wounding for cells expressing control siRNA (CTRL) or siRNA against NDP52, OPTN, p62, or NBR1. Dashed yellow lines highlight wound boundaries. Bars, 100 µm. (B) Quantification of wound closure over 6 h by cells expressing indicated siRNAs. The decrease in wound width was determined by subtracting the final width at 6 h from the initial width at 0 h. Bar graph shows mean + SEM, representing n = 8 wounds for siCTRL, n = 8 wounds for siNDP52, n = 8 wounds for siOPTN, n = 6 wounds for sip62, n = 6 wounds for siNBR1, and n = 5 wounds for mock (no siRNA) pooled from four independent experiments. P-values calculated using one-way analysis of variance followed by Tukey post-hoc test. n.s., not significant. (C) Representative phase-contrast microscopy images of cells expressing shCTRL or shNBR1 at time of wounding (0 h) and at 5 h after wounding. Dashed yellow lines highlight wound boundaries. Bars, 100 µm. (D) Quantification of wound closure over 5 h by shCTRL and shNBR1 cells. Bar graph shows mean + SEM, representing n = 12 wounds for shCTRL and n = 15 wounds for shNBR1 pooled from three independent experiments. P-value determined using unpaired t test. (E) Spinning disk confocal microscopy time-lapse sequences of cells expressing paxillin-mCherry (black) to monitor FA dynamics. Left panels show representative cells expressing shCTRL (top) or shNBR1 (bottom). Image sequences of boxed regions on the right have been rotated such that the cell edge with dynamic FAs is moving upward vertically. Elapsed time (min) in top left of images. Bars, 5 µm. Insets are magnified twofold. These images correspond to Videos 7 and 8. (F) Quantification of FA assembly rate constants (left), disassembly rate constants (middle), and lifetime (right) for FAs in shCTRL or shNBR1 cells. Data presented as median (line), first and third quartile (box), and whiskers extend to ±1.5 times the interquartile range. Individual data points outside of this range are shown. n = 53 FAs for shCTRL and n = 58 FAs for shNBR1, pooled from three independent experiments. P-value calculated using a nonparametric Mann-Whitney test.
Figure 6.
Figure 6.
NBR1-mediated selective autophagy promotes FA disassembly. (A) Representative spinning disk confocal image of a migrating cell stably expressing paxillin-mTurquoise, Venus-LC3, and mCherry-NBR1. Whole-cell merged image shown at left and enlarged boxed insets of two- and three-color merged images shown at right. Bar, 2.5 µm. Insets are magnified 1.4-fold. (B) Quantification of mCherry-NBR1 colocalization with FA-associated Venus-LC3 vesicles. FA-associated Venus-LC3 vesicles were identified as described in Fig. 4 B, and then the number of mCherry-NBR1-positive and -negative vesicles were enumerated. Scatter plot shows individual single cells (n = 16 total cells) and mean (line), representing 170 total FA-associated Venus-LC3 vesicles analyzed from two independent experiments. (C) Quantification of the percentage of dynamic leading edge FAs per cell _targeted by autophagosomes in shCTRL or shNBR1 cells. FAs were randomly chosen independent of the GFP channel and then manually tracked for evidence of direct contact by GFP-LC3 vesicles as described in Fig. 4 B. Scatter plot shows individual single cells (n = 17 cells for shCTRL and n = 18 cells for shNBR1) and mean (line), representing 165 FAs for shCTRL and 159 FAs for shNBR1 analyzed from two independent experiments. P-value determined using unpaired t test. (D) Schematic of wild-type NBR1 (left) and autophagy-defective NBR1 (NBR1 ΔLIR, right) resulting from deletion of the LIR (aa 727–738, depicted as vertical line). Bottom diagram demonstrates inability of NBR1 ΔLIR to bind LC3 (right) and be recruited into autophagosomes, unlike wild-type NBR1 (left). (E) Nutrient-starved (HBSS, 4 h) HEK-293T cells ectopically expressing wild-type GFP-NBR1 or GFP-NBR1 ΔLIR. GAPDH is loading control. (F) Quantification of FA assembly rate constants (left), disassembly rate constants (middle), and lifetime (right) for FAs in cells expressing GFP control, GFP-NBR1, GFP-NBR1 ΔLIR, or GFP-NBR1 ΔUBA. Data presented as median (line), first and third quartile (box), and whiskers extend to ±1.5 times the interquartile range. Individual data points outside of this are shown. n = 99 FAs for GFP control, n = 84 FAs for GFP-NBR1, n = 62 FAs for GFP-NBR1 ΔLIR, and n = 62 FAs for GFP-NBR1 ΔUBA, pooled from four independent experiments. P-values calculated using a nonparametric Kruskall-Wallis test followed by Dunn post-hoc test. n.s., not significant.

Similar articles

Cited by

References

    1. Birgisdottir A.B., Lamark T., and Johansen T.. 2013. The LIR motif - crucial for selective autophagy. J. Cell Sci. 126:3237–3247. 10.1242/jcs.12612 - DOI - PubMed
    1. Campeau E., Ruhl V.E., Rodier F., Smith C.L., Rahmberg B.L., Fuss J.O., Campisi J., Yaswen P., Cooper P.K., and Kaufman P.D.. 2009. A versatile viral system for expression and depletion of proteins in mammalian cells. PLoS One. 4:e6529 10.1371/journal.pone.0006529 - DOI - PMC - PubMed
    1. Cavalcanti-Adam E.A., Volberg T., Micoulet A., Kessler H., Geiger B., and Spatz J.P.. 2007. Cell spreading and focal adhesion dynamics are regulated by spacing of integrin ligands. Biophys. J. 92:2964–2974. 10.1529/biophysj.106.089730 - DOI - PMC - PubMed
    1. Chan K.T., Bennin D.A., and Huttenlocher A.. 2010. Regulation of adhesion dynamics by calpain-mediated proteolysis of focal adhesion kinase (FAK). J. Biol. Chem. 285:11418–11426. 10.1074/jbc.M109.090746 - DOI - PMC - PubMed
    1. Chao W.T., and Kunz J.. 2009. Focal adhesion disassembly requires clathrin-dependent endocytosis of integrins. FEBS Lett. 583:1337–1343. 10.1016/j.febslet.2009.03.037 - DOI - PMC - PubMed

Publication types

Substances

Associated data

  NODES
Association 1
Project 1
twitter 2