. 2016 Apr 12:6:24049.
doi: 10.1038/srep24049.

Quercetin, a Natural Flavonoid Interacts with DNA, Arrests Cell Cycle and Causes Tumor Regression by Activating Mitochondrial Pathway of Apoptosis

Affiliations

Quercetin, a Natural Flavonoid Interacts with DNA, Arrests Cell Cycle and Causes Tumor Regression by Activating Mitochondrial Pathway of Apoptosis

Shikha Srivastava et al. Sci Rep. .

Abstract

Naturally occurring compounds are considered as attractive candidates for cancer treatment and prevention. Quercetin and ellagic acid are naturally occurring flavonoids abundantly seen in several fruits and vegetables. In the present study, we evaluate and compare antitumor efficacies of quercetin and ellagic acid in animal models and cancer cell lines in a comprehensive manner. We found that quercetin induced cytotoxicity in leukemic cells in a dose-dependent manner, while ellagic acid showed only limited toxicity. Besides leukemic cells, quercetin also induced cytotoxicity in breast cancer cells, however, its effect on normal cells was limited or none. Further, quercetin caused S phase arrest during cell cycle progression in tested cancer cells. Quercetin induced tumor regression in mice at a concentration 3-fold lower than ellagic acid. Importantly, administration of quercetin lead to ~5 fold increase in the life span in tumor bearing mice compared to that of untreated controls. Further, we found that quercetin interacts with DNA directly, and could be one of the mechanisms for inducing apoptosis in both, cancer cell lines and tumor tissues by activating the intrinsic pathway. Thus, our data suggests that quercetin can be further explored for its potential to be used in cancer therapeutics and combination therapy.


Figures

Figure 1
Figure 1. Determination of the cytotoxic effect of quercetin and ellagic acid on leukemic cell lines.
Cell viability and cell proliferation was determined by MTT and trypan blue assays respectively, on CEM, K562 and Nalm6 cell lines. Cell lines were treated with quercetin (QR) (A) or ellagic acid (EA) (B) for 48 h. DMSO treated cells served as vehicle control (denoted as ‘C’) in both the cases. Concentrations of compound used were 10, 50, 100 and 250 μM. ‘ns’ is ‘not significant’ while ‘*’ represents significance (*P < 0.05, **P < 0.01, ***P < 0.001). Data represents SEM of three independent repeats.
Figure 2
Figure 2. Effect of quercetin on cell cycle progression in Nalm6 cells.
(A) Nalm6 cells (0.75 × 105 cells/ml) were incubated at 37 °C with quercetin (20 μM) for 8, 16 and 24 h. Following incubation, cells were harvested, fixed and stained with propidium iodide and analysed by flow cytometry. (B) Bar diagram showing the percentage of cells in S phase of cell cycle. (C) Cell cycle distribution of Nalm6 cells after treating with increasing concentrations (10, 50, 100, 250 μM) of quercetin for 48 h. Histogram resulted after flow cytometry analysis is shown. (D) Bar diagrams showing percentage of cells in each phase of cell cycle. C represents cells alone, while VC stands for DMSO treated vehicle control. In each case M1 represents G1 phase, M2 represents G2 phase, M3 represents S phase and M4 represents Sub G1 phase. Error bars represents SEM of two independent repeats and ‘*’indicates the significance, *P < 0.05.
Figure 3
Figure 3. Determination of mode of action of quercetin.
(A) Conformational changes induced by quercetin in DNA was assessed by incubating calf thymus (CT) DNA with different concentrations of quercetin (50, 100, 150 μM) for 1 h at room temperature. Following incubation, CD spectra was recorded at wavelength of 210–320 nm. Ethidium bromide (10, 20 μM) stained DNA served as a positive control. ‘0 μM’ is the untreated CT DNA. Boxed region represents the shift in DNA peak due to intercalation of the compounds. (B,C) Gel mobility shift assay was performed using 100 ng pUC18 DNA. The linearized (digested with EcoRI) (B) and supercoiled (C) pUC18 DNA were incubated at room temperature for 1 h with increasing concentrations of quercetin (10, 50, 100, 150, 200, 250 μM) and products were resolved. Ethidium bromide (2.5, 10, 25 μM) stained DNA served as positive control for the assay. Stained DNA was resolved on 1.2% agarose gel at 30 V. Boxes indicate the shift in the DNA band position due to intercalation.
Figure 4
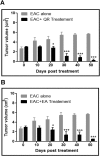
Figure 4. Evaluation of effect of quercetin and ellagic acid on tumor growth in mice.
Solid tumor was induced in female Swiss albino mice by injecting EAC cells intramuscularly. (A) Six doses of quercetin (1 mg/kg body wt) and (B) ellagic acid (3 mg/kg body wt) were administered every third day from 12th day of EAC cell injection. Data shows the tumor volume at different time intervals with and without treatment of the compound. Data was collected from three independent experiments with a set of five animals each. Error bars indicate the standard deviation (SD) of three independent experiments. P value was calculated by comparing the mean of untreated control group (EAC alone) and with mean of quercetin treated group, *P < 0.05, ***P < 0.001.
Figure 5
Figure 5. Evaluation of effect of quercetin on survival of tumor bearing mice and its side effects.
(A) Kaplan-Meier survival curve of female Swiss albino mice treated with quercetin (1 mg/kg, six doses). The experiment was performed in two independent batches with a set of five animals each. ‘**’ represents significance, **P < 0.01. (B) Histopathologic analysis of tumor following quercetin treatment. Histological sections of thigh of tumor bearing mouse with (treated tumor) and without treatment (control tumor) of quercetin after 30th day (d–f) and (a–c) and 45th day (j–l) and (g–i) of tumor development. Final magnifications shown are 100× (a, d, g and j panel), 200× (b, e, h and k panel), and 400× (c, f, i and l panel). ‘M’ is muscle, ‘TC’ is tumor cells and ‘ITC’ stands for infiltering tumor cells.
Figure 6
Figure 6. Evaluation of quercetin mediated cytotoxicity and its mechanism in tumor tissues.
(A) TUNEL assay showing DNA fragmentation on 30th day of quercetin treated tumor tissues in comparison to untreated control tumor. Brown color nuclei indicate DAB staining showing DNA breaks, while nuclei with intact DNA were stained with methyl green. Final magnifications shown are 200× and 400×. (B) Bar diagram with SEM (n = 5) represents % TUNEL positive nuclei in tumor control and quercetin treated mice tissues. ‘*’ represents P < 0.05. (C) Immuno staining was performed on paraffin embedded tissue sections for Ki-67, p-p53 and p53 using respective antibodies in control tumor tissues and quercetin treated tumor tissues after 30th day of treatment. Final magnification shown is 400×. (D) The images of IHC were quantified and plotted as SEM (n = 5). ‘*’represents significance (*P < 0.05, **P < 0.01).
Figure 7
Figure 7. Assessment of effect of quercetin on mitochondrial transmembrane potential (ΔψM) and apoptosis.
(A) Nalm6 cells were treated with quercetin (10, 20, 50 and 100 μM) for 12 h. Cells were harvested, stained with JC1 dye for 20 min at 37o C and analyzed using flow cytometer. Depolarization in mitochondrial membrane potential was assessed by a shift from red to green fluorescence, where red indicates JC1 aggregates in intact mitochondria and green represents green fluorescing monomers in cytosol depicting loss in mitochondrial potential. VC represents DMSO treated vehicle control. Bar diagram shows percentage of depolarized population after quercetin treatment. ‘*’represents significance where *P < 0.05, **P < 0.01. 2,4 DNP treated cells served as positive control. (B) Annexin V/PI dual staining of Nalm6 cells for the detection of apoptotic stages following treatment with quercetin. Nalm6 cells were stained with annexin V-FITC/PI after treatment with quercetin (0, 20 and 50 μM) for 6, 12, 18, 24 and 48 h. Cells were analysed quantitatively as well as qualitatively. Histogram showing distribution of annexin V-FITC/PI stained cells. In each panel lower left quadrant shows the cells negative to both annexin V-FITC and PI staining, lower right panel shows the cells stained with annexin V (early apoptotic cells), upper left quadrant shows cells stained with PI alone (necrotic cells) and upper right shows the cells positive for both annexin V and PI (late apoptotic cells). Histogram showing distribution of early and late apoptotic cells as well as necrotic cells following treatment with quercetin for 6, 12, 18, 24 and 48 h, respectively. Error bar represents standard error mean (SEM) of atleast two independent repeats. P value has been calculated as compared to DMSO control in each case where *P < 0.05, **P < 0.01, ***P < 0.001.
Figure 8
Figure 8. Effect of quercetin on expression of apoptotic proteins and mechanism of action.
(A) Expression level of apoptotic proteins following treatment with quercetin. Cell lysate was prepared after treating Nalm6 cells with quercetin (0, 10, 20 μM, for 24 h). Protein lysate was resolved on SDS-PAGE and immunoblotting was performed using appropriate primary and secondary antibodies. Expression pattern was studied for p53, p-p53, BCL2, BCL-xL, BAX, MCL 1, CYTOCHROME C, SMAC/DIABLO, activated CASPASE 3, CASPASE 9, PARP1 and Tubulin. Ponceau stained PVDF membrane after protein transfer acted as a control for equal protein loading. (B) Detection of DNA fragmentation in Nalm6 cells following treatment with quercetin. Chromosomal DNA was extracted after treatment with quercetin (10, 50, 100, 250 μM). The purified DNA was resolved on 2% agarose gel at 50 V for 5 h. M is hyper ladder I (Bioline). 5-fluorouracil (5-FU; 100 μM) was used as positive control. (C) Proposed model for quercetin induced apoptosis leading to cytotoxicity. Treatment of cancer cells with quercetin leads to apoptosis through activation of mitochondrial intrinsic pathway. Since quercetin is a DNA intercalator, it might induce DNA damage, which leads to the upregulation of p53. This results in the down regulation of antiapoptotic protein, BCL2 and cleavage of MCL1. CYTOCHROME C and SMAC/DIABLO are released due to loss in mitochondrial membrane potential. SMAC/DIABLO inhibits IAPs (inhibitors of apoptosis proteins), while CYTOCHROME C release leads to cleavage of CASPASE 9, which in turn cleaves CASPASE 3. CASPASE 3 leads to fragmentation and degradation of cellular DNA and activation of PARP1 resulting in apoptosis.

Similar articles

Cited by

References

    1. Mertens-Talcott S. U. & Percival S. S. Ellagic acid and quercetin interact synergistically with resveratrol in the induction of apoptosis and cause transient cell cycle arrest in human leukemia cells. Cancer Lett 218, 141–151 (2005). - PubMed
    1. Mertens-Talcott S. U., Talcott S. T. & Percival S. S. Low concentrations of quercetin and ellagic acid synergistically influence proliferation, cytotoxicity and apoptosis in MOLT-4 human leukemia cells. J Nutr 133, 2669–2674 (2003). - PubMed
    1. Haghiac M. & Walle T. Quercetin induces necrosis and apoptosis in SCC-9 oral cancer cells. Nutr Cancer 53, 220–231 (2005). - PubMed
    1. Senthilkumar K. et al.. Quercetin regulates insulin like growth factor signaling and induces intrinsic and extrinsic pathway mediated apoptosis in androgen independent prostate cancer cells (PC-3). Mol Cell Biochem 344, 173–184 (2010). - PubMed
    1. Zhang H. et al.. Antitumor activities of quercetin and quercetin-5′,8-disulfonate in human colon and breast cancer cell lines. Food Chem Toxicol 50, 1589–1599 (2012). - PubMed

Publication types

LinkOut - more resources

  NODES
admin 5
Note 1
twitter 2