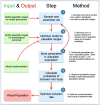
Efficient Generation and Selection of Virtual Populations in Quantitative Systems Pharmacology Models
- PMID: 27069777
- PMCID: PMC4809626
- DOI: 10.1002/psp4.12063
Efficient Generation and Selection of Virtual Populations in Quantitative Systems Pharmacology Models
Abstract
Quantitative systems pharmacology models mechanistically describe a biological system and the effect of drug treatment on system behavior. Because these models rarely are identifiable from the available data, the uncertainty in physiological parameters may be sampled to create alternative parameterizations of the model, sometimes termed "virtual patients." In order to reproduce the statistics of a clinical population, virtual patients are often weighted to form a virtual population that reflects the baseline characteristics of the clinical cohort. Here we introduce a novel technique to efficiently generate virtual patients and, from this ensemble, demonstrate how to select a virtual population that matches the observed data without the need for weighting. This approach improves confidence in model predictions by mitigating the risk that spurious virtual patients become overrepresented in virtual populations.
Figures


Similar articles
-
Improving the generation and selection of virtual populations in quantitative systems pharmacology models.Prog Biophys Mol Biol. 2018 Nov;139:15-22. doi: 10.1016/j.pbiomolbio.2018.06.002. Epub 2018 Jun 15. Prog Biophys Mol Biol. 2018. PMID: 29902482
-
Alternate virtual populations elucidate the type I interferon signature predictive of the response to rituximab in rheumatoid arthritis.BMC Bioinformatics. 2013 Jul 10;14:221. doi: 10.1186/1471-2105-14-221. BMC Bioinformatics. 2013. PMID: 23841912 Free PMC article.
-
Virtual Populations for Quantitative Systems Pharmacology Models.Methods Mol Biol. 2022;2486:129-179. doi: 10.1007/978-1-0716-2265-0_8. Methods Mol Biol. 2022. PMID: 35437722
-
Linear-In-Flux-Expressions Methodology: Toward a Robust Mathematical Framework for Quantitative Systems Pharmacology Simulators.Gene Regul Syst Bio. 2017 Jul 26;11:1177625017711414. doi: 10.1177/1177625017711414. eCollection 2017. Gene Regul Syst Bio. 2017. PMID: 29581702 Free PMC article. Review.
-
Virtual reality simulation training for health professions trainees in gastrointestinal endoscopy.Cochrane Database Syst Rev. 2012 Jun 13;(6):CD008237. doi: 10.1002/14651858.CD008237.pub2. Cochrane Database Syst Rev. 2012. Update in: Cochrane Database Syst Rev. 2018 Aug 17;8:CD008237. doi: 10.1002/14651858.CD008237.pub3 PMID: 22696375 Updated. Review.
Cited by
-
Virtual clinical trials of anti-PD-1 and anti-CTLA-4 immunotherapy in advanced hepatocellular carcinoma using a quantitative systems pharmacology model.J Immunother Cancer. 2022 Nov;10(11):e005414. doi: 10.1136/jitc-2022-005414. J Immunother Cancer. 2022. PMID: 36323435 Free PMC article. Clinical Trial.
-
Realizing the promise of Project Optimus: Challenges and emerging opportunities for dose optimization in oncology drug development.CPT Pharmacometrics Syst Pharmacol. 2024 May;13(5):691-709. doi: 10.1002/psp4.13079. Epub 2024 Mar 21. CPT Pharmacometrics Syst Pharmacol. 2024. PMID: 37969061 Free PMC article. Review.
-
A pediatric quantitative systems pharmacology model of neurofilament trafficking in spinal muscular atrophy treated with the antisense oligonucleotide nusinersen.CPT Pharmacometrics Syst Pharmacol. 2023 Feb;12(2):196-206. doi: 10.1002/psp4.12890. Epub 2022 Dec 5. CPT Pharmacometrics Syst Pharmacol. 2023. PMID: 36471456 Free PMC article.
-
Determinants of combination GM-CSF immunotherapy and oncolytic virotherapy success identified through in silico treatment personalization.PLoS Comput Biol. 2019 Nov 27;15(11):e1007495. doi: 10.1371/journal.pcbi.1007495. eCollection 2019 Nov. PLoS Comput Biol. 2019. PMID: 31774808 Free PMC article.
-
Digital twins in medicine.Nat Comput Sci. 2024 Mar;4(3):184-191. doi: 10.1038/s43588-024-00607-6. Epub 2024 Mar 26. Nat Comput Sci. 2024. PMID: 38532133 Review.
References
-
- van der graaf, P.H. & Benson, N. Systems pharmacology: bridging systems biology and pharmacokinetics‐pharmacodynamics (PKPD) in drug discovery and development. Pharm. Res. 28, 1460–1464 (2011). - PubMed
-
- Allerheiligen, S.R.B. Next‐generation model‐based drug discovery and development: quantitative and systems pharmacology. Clin. Pharmacol. Ther. 88, 135–137 (2010). - PubMed
-
- Sorger, P.K. et al Quantitative and systems pharmacology in the post‐genomic era: new approaches to discovering drugs and understanding therapeutic mechanisms. A NIH White Paper by the QSP Workshop Group‐October 2011 (2011).
-
- Peterson, M.C. & Riggs, M.M. A physiologically based mathematical model of integrated calcium homeostasis and bone remodeling. Bone 46, 49–63 (2010). - PubMed
-
- Hallow, K.M. et al A model‐based approach to investigating the pathophysiological mechanisms of hypertension and response to antihypertensive therapies: extending the Guyton model. AJP Regul. Integr. Comp. Physiol. 306, R647–R662 (2014). - PubMed
MeSH terms
LinkOut - more resources
Full Text Sources
Other Literature Sources

