. 2016 Apr 26;113(17):4753-8.
doi: 10.1073/pnas.1516604113. Epub 2016 Apr 11.

A transcriptional signature of Alzheimer's disease is associated with a metastable subproteome at risk for aggregation

Affiliations

A transcriptional signature of Alzheimer's disease is associated with a metastable subproteome at risk for aggregation

Prajwal Ciryam et al. Proc Natl Acad Sci U S A. .

Abstract

It is well-established that widespread transcriptional changes accompany the onset and progression of Alzheimer's disease. Because of the multifactorial nature of this neurodegenerative disorder and its complex relationship with aging, however, it remains unclear whether such changes are the result of nonspecific dysregulation and multisystem failure or instead are part of a coordinated response to cellular dysfunction. To address this problem in a systematic manner, we performed a meta-analysis of about 1,600 microarrays from human central nervous system tissues to identify transcriptional changes upon aging and as a result of Alzheimer's disease. Our strategy to discover a transcriptional signature of Alzheimer's disease revealed a set of down-regulated genes that encode proteins metastable to aggregation. Using this approach, we identified a small number of biochemical pathways, notably oxidative phosphorylation, enriched in proteins vulnerable to aggregation in control brains and encoded by genes down-regulated in Alzheimer's disease. These results suggest that the down-regulation of a metastable subproteome may help mitigate aberrant protein aggregation when protein homeostasis becomes compromised in Alzheimer's disease.

Keywords: amyloid formation; neurodegenerative diseases; protein aggregation; protein misfolding; protein supersaturation.


Conflict of interest statement

The authors declare no conflict of interest.

Figures

Fig. S1.
Fig. S1.
Differences in metastability between transcriptionally regulated proteins in aging are robust against changes in differential expression thresholds. A range of values for thresholds of minimum percentage change (0.5–50%) and P value (10−20 to 1) was used to determine which genes are increased, decreased, or unchanged in expression upon aging. A total of 18,100 combinations were considered. Supersaturation scores were then calculated for the proteins corresponding to differentially expressed genes. The corresponding protein supersaturation was assessed in terms of (A and C) P value and (B and D) median fold difference. This analysis was performed for down-regulated (A and B) and up-regulated (C and D) genes.
Fig. S2.
Fig. S2.
Differences in metastability between transcriptionally regulated proteins in AD are robust against changes in differential expression thresholds. A range of values for thresholds of minimum percentage change (0.5–50%) and P value (10−20 to 1) was used to determine which genes are increased, decreased, or unchanged in expression in AD. A total of 18,100 combinations were considered. Supersaturation scores were then calculated for the proteins corresponding to differentially expressed genes. The corresponding protein supersaturation was assessed in terms of (A and C) P value and (B and D) median fold difference. This analysis was performed for down-regulated (A and B) and up-regulated (C and D) genes.
Fig. 1.
Fig. 1.
Proteins that aggregate in AD correspond to transcriptionally down-regulated genes. (A and B) Fraction of proteins corresponding to transcriptionally down-regulated (A) or up-regulated (B) genes in AD in the whole proteome (Prt; down-regulated fraction 1,907/19,254; up-regulated fraction 1,509/19,254) and for amyloid deposits (A; 1/23; 2/23), plaques (P; 9/26; 3/26), and tangles (T; 36/88; 9/88). (C and D) Fraction of proteins corresponding to transcriptionally down-regulated (C) or up-regulated (D) genes in aging in the whole proteome (432/17,833; 534/17,833), and for amyloid deposits (1/23; 0/23), plaques (1/26; 0/26), and tangles (9/88; 3/88). The statistical significance of the difference with the proteome (first column) was assessed with a Fisher’s exact test with Holm–Bonferroni corrections (**P < 0.001, ****P < 0.0001).
Fig. 2.
Fig. 2.
Transcriptionally regulated genes in aging and AD correspond to proteins metastable against aggregation. (AC) Assessment of the metastability to aggregation of the proteins associated with differentially expressed genes in (A) AD, (B) aging, and (C) the overlap between the two groups. The median fold difference in supersaturation (which is a measure of metastability to aggregation) is indicated by Fold Δ. NC, Down, and Up indicate, respectively, no change in expression, down-regulation, and up-regulation. Whiskers range from the lowest to highest value data points within 150% of the interquartile ranges. (D and E) Overlap between the 5% most supersaturated proteins and the corresponding genes either (D) down-regulated or (E) up-regulated in aging and AD. The number of proteins in each subset is indicated. (F) Fraction of genes down-regulated (blue) and up-regulated (orange) in the whole proteome (down-regulated fraction 1,907/19,254; up-regulated fraction 1,509/19,254) and the protein homeostasis network (PN; 1,509/19,254; 148/2,041). For AC, ****P ≤ 0.0001, one-sided Wilcoxon/Mann–Whitney test with Holm–Bonferroni correction. For D and E, *P ≤ 0.05, ****P ≤ 0.0001, one-sided Fisher’s exact test with Holm–Bonferroni correction.
Fig. 3.
Fig. 3.
Metastability of proteins to aggregation is correlated with the down-regulation of the corresponding genes in AD. Metastability levels, assessed by supersaturation scores, for proteins associated with differentially expressed genes: (A) down-regulated in AD, (B) up-regulated in AD, (C) down-regulated in aging, and (D) up-regulated in aging. Differentially expressed genes are divided into thirds (low, L; medium, M; high, H) based on the fold change of expression. The median fold difference in supersaturation is indicated by Fold Δ. NC indicates no change in expression. ****P ≤ 0.0001, one-sided Wilcoxon/Mann–Whitney test with Holm–Bonferroni correction. Whiskers range from the lowest to highest value data points within 150% of the interquartile ranges.
Fig. S3.
Fig. S3.
Metastability levels are correlated with average expression levels for genes down-regulated in AD. (Left) Plot of protein supersaturation scores against the fold change in expression for the corresponding genes in AD (AD, Upper Left), aging based on the AD studies [Age (AD), Upper Right], clinical depression (CD, Lower Left), and aging based on the clinical depression studies [Age (CD), Lower Right]. (Right) Pearson’s correlation coefficient (r2) for the categories plotted (Left).
Fig. S4.
Fig. S4.
Metastability of proteins encoded by differentially expressed genes is elevated in AD and aging for a range of expression values. Supersaturation of proteins associated with downregulated (A and B) and upregulated (C and D) genes in AD (circles) and aging (triangles) was determined after restricting the genes of interest to those above a range of expression levels plotted by expression percentile rank. (A and B) Fold Δ and (C and D) P value are plotted. Orange points represent values for down-regulated genes; blue points represent values for up-regulated genes. The median fold difference in supersaturation is indicated by Fold Δ. P values are calculated using the one-sided Wilcoxon/Mann–Whitney test with Holm–Bonferroni correction.
Fig. S5.
Fig. S5.
Differences in metastability between transcriptionally regulated proteins in AD are robust against Gaussian noise in the supersaturation score. Test of the robustness of the significance of the (A and C) median fold difference and (B and D) P value of supersaturation for proteins transcriptionally (A and B) down-regulated or (C and D) up-regulated in AD. Gaussian noise was introduced 100 independent times into the proteome scores at levels ranging from 1.1× to 100× (where 1× signifies no noise). Tests were performed at each noise level to determine whether the 100 median fold differences obtained were significantly greater than 1 and the 100 P values obtained were significantly below 0.05. For down-regulated genes, supersaturation (A) median fold difference is robust up to 100× and (B) P value is robust up to 7×. For up-regulated genes, supersaturation (C) median fold difference is robust up to 100× and (D) P value is robust up to 2.25×. Error bars indicate interquartile ranges; green points indicate P ≤ 0.05 by the one-sided Wilcoxon/Mann–Whitney test.
Fig. S6.
Fig. S6.
Differences in metastability between transcriptionally regulated proteins in aging are robust against Gaussian noise in the supersaturation score. Test of the robustness of the significance of the (A and C) median fold difference and (B and D) P value of supersaturation for proteins transcriptionally (A and B) down-regulated or (C and D) up-regulated in aging (AD dataset). Gaussian noise was introduced 100 independent times into the proteome scores at levels ranging from 1.1× to 100× (where 1× signifies no noise). Tests were performed at each noise level to determine whether the 100 median fold differences obtained were significantly greater than 1 and the 100 P values obtained were significantly below 0.05. For down-regulated genes, supersaturation (A) median fold difference is robust up to 3.75× and (B) P value is robust up to 2.25×. For up-regulated genes, supersaturation (C) median fold difference is robust up to 100× and (D) P value is robust up to 1.1×. Error bars indicate interquartile ranges; green points indicate P ≤ 0.05 by the one-sided Wilcoxon/Mann–Whitney test.
Fig. 4.
Fig. 4.
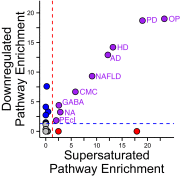
Comparison between down-regulated and metastable biochemical pathways and networks. We found that the biochemical pathways and networks down-regulated in AD correspond closely to those enriched in supersaturated proteins (purple circles). Using the KEGG classification, these biochemical pathways and networks are oxidative phosphorylation, Parkinson’s disease, Huntington’s disease, Alzheimer’s disease, nonalcoholic fatty liver disease, cardiac muscle contraction, nicotine addiction, GABAergic synapse, and pathogenic E. coli infection.
Fig. S7.
Fig. S7.
Elevated metastability of proteins encoded by differentially expressed genes in AD and aging is not dependent on oxidative phosphorylation proteins. Supersaturation of proteins associated with differentially expressed genes in (A) AD, (B) aging, and (C) the overlap between the two, but with those proteins found in the KEGG pathway for oxidative phosphorylation excluded. The median fold difference in supersaturation is indicated by Fold Δ. NC indicates genes that do not change significantly in expression. ****P ≤ 0.0001, one-sided Wilcoxon/Mann–Whitney test with Holm–Bonferroni correction. Whiskers range from the lowest to highest value data points within 150% of the interquartile ranges.

Similar articles

Cited by

References

    1. Knowles TP, Vendruscolo M, Dobson CM. The amyloid state and its association with protein misfolding diseases. Nat Rev Mol Cell Biol. 2014;15(6):384–396. - PubMed
    1. Querfurth HW, LaFerla FM. Alzheimer’s disease. N Engl J Med. 2010;362(4):329–344. - PubMed
    1. Selkoe D, Mandelkow E, Holtzman D. Deciphering Alzheimer disease. Cold Spring Harb Perspect Med. 2012;2(1):a011460. - PMC - PubMed
    1. Rubinsztein DC. The roles of intracellular protein-degradation pathways in neurodegeneration. Nature. 2006;443(7113):780–786. - PubMed
    1. Glass CK, Saijo K, Winner B, Marchetto MC, Gage FH. Mechanisms underlying inflammation in neurodegeneration. Cell. 2010;140(6):918–934. - PMC - PubMed

Publication types

  NODES
Association 1
twitter 2