Combined Gene Expression and RNAi Screening to Identify Alkylation Damage Survival Pathways from Fly to Human
- PMID: 27100653
- PMCID: PMC4839732
- DOI: 10.1371/journal.pone.0153970
Combined Gene Expression and RNAi Screening to Identify Alkylation Damage Survival Pathways from Fly to Human
Abstract
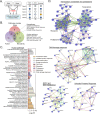
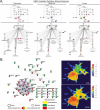
Alkylating agents are a key component of cancer chemotherapy. Several cellular mechanisms are known to be important for its survival, particularly DNA repair and xenobiotic detoxification, yet genomic screens indicate that additional cellular components may be involved. Elucidating these components has value in either identifying key processes that can be modulated to improve chemotherapeutic efficacy or may be altered in some cancers to confer chemoresistance. We therefore set out to reevaluate our prior Drosophila RNAi screening data by comparison to gene expression arrays in order to determine if we could identify any novel processes in alkylation damage survival. We noted a consistent conservation of alkylation survival pathways across platforms and species when the analysis was conducted on a pathway/process level rather than at an individual gene level. Better results were obtained when combining gene lists from two datasets (RNAi screen plus microarray) prior to analysis. In addition to previously identified DNA damage responses (p53 signaling and Nucleotide Excision Repair), DNA-mRNA-protein metabolism (transcription/translation) and proteasome machinery, we also noted a highly conserved cross-species requirement for NRF2, glutathione (GSH)-mediated drug detoxification and Endoplasmic Reticulum stress (ER stress)/Unfolded Protein Responses (UPR) in cells exposed to alkylation. The requirement for GSH, NRF2 and UPR in alkylation survival was validated by metabolomics, protein studies and functional cell assays. From this we conclude that RNAi/gene expression fusion is a valid strategy to rapidly identify key processes that may be extendable to other contexts beyond damage survival.
Conflict of interest statement
Figures


Similar articles
-
A network of conserved damage survival pathways revealed by a genomic RNAi screen.PLoS Genet. 2009 Jun;5(6):e1000527. doi: 10.1371/journal.pgen.1000527. Epub 2009 Jun 19. PLoS Genet. 2009. PMID: 19543366 Free PMC article.
-
Exploring the Conserved Role of MANF in the Unfolded Protein Response in Drosophila melanogaster.PLoS One. 2016 Mar 14;11(3):e0151550. doi: 10.1371/journal.pone.0151550. eCollection 2016. PLoS One. 2016. PMID: 26975047 Free PMC article.
-
NOXA contributes to the sensitivity of PERK-deficient cells to ER stress.FEBS Lett. 2012 Nov 16;586(22):4023-30. doi: 10.1016/j.febslet.2012.10.002. Epub 2012 Oct 12. FEBS Lett. 2012. PMID: 23068609
-
Methods for High-Throughput RNAi Screening in Drosophila Cells.Methods Mol Biol. 2016;1478:95-116. doi: 10.1007/978-1-4939-6371-3_5. Methods Mol Biol. 2016. PMID: 27730577 Review.
-
A Guide to Genome-Wide In Vivo RNAi Applications in Drosophila.Methods Mol Biol. 2016;1478:117-143. doi: 10.1007/978-1-4939-6371-3_6. Methods Mol Biol. 2016. PMID: 27730578 Review.
Cited by
-
A DNA repair-independent role for alkyladenine DNA glycosylase in alkylation-induced unfolded protein response.Proc Natl Acad Sci U S A. 2022 Mar 1;119(9):e2111404119. doi: 10.1073/pnas.2111404119. Proc Natl Acad Sci U S A. 2022. PMID: 35197283 Free PMC article.
-
Alkylating Agent-Induced NRF2 Blocks Endoplasmic Reticulum Stress-Mediated Apoptosis via Control of Glutathione Pools and Protein Thiol Homeostasis.Mol Cancer Ther. 2016 Dec;15(12):3000-3014. doi: 10.1158/1535-7163.MCT-16-0271. Epub 2016 Sep 16. Mol Cancer Ther. 2016. PMID: 27638861 Free PMC article.
-
Sorafenib improves alkylating therapy by blocking induced inflammation, invasion and angiogenesis in breast cancer cells.Cancer Lett. 2018 Jul 1;425:101-115. doi: 10.1016/j.canlet.2018.03.037. Epub 2018 Mar 30. Cancer Lett. 2018. PMID: 29608984 Free PMC article.
-
Transcriptomic Profiling of MDA-MB-231 Cells Exposed to Boswellia Serrata and 3-O-Acetyl-B-Boswellic Acid; ER/UPR Mediated Programmed Cell Death.Cancer Genomics Proteomics. 2017 Nov-Dec;14(6):409-425. doi: 10.21873/cgp.20051. Cancer Genomics Proteomics. 2017. PMID: 29109091 Free PMC article. Review.
-
Correlation AnalyzeR: functional predictions from gene co-expression correlations.BMC Bioinformatics. 2021 Apr 20;22(1):206. doi: 10.1186/s12859-021-04130-7. BMC Bioinformatics. 2021. PMID: 33879054 Free PMC article.
References
-
- Walhout AJ, Reboul J, Shtanko O, Bertin N, Vaglio P, Ge H, et al. Integrating interactome, phenome, and transcriptome mapping data for the C. elegans germline. Current biology: CB. 2002;12(22):1952–8. Epub 2002/11/26. . - PubMed
Publication types
MeSH terms
Substances
Grants and funding
LinkOut - more resources
Full Text Sources
Other Literature Sources
Molecular Biology Databases
Research Materials
Miscellaneous

