. 2016 May 18:6:26165.
doi: 10.1038/srep26165.

Penfluridol suppresses pancreatic tumor growth by autophagy-mediated apoptosis

Affiliations

Penfluridol suppresses pancreatic tumor growth by autophagy-mediated apoptosis

Alok Ranjan et al. Sci Rep. .

Abstract

Pancreatic tumors exhibit enhanced autophagy as compared to any other cancer, making it resistant to chemotherapy. We evaluated the effect of penfluridol against pancreatic cancer. Penfluridol treatment induced apoptosis and inhibited the growth of Panc-1, BxPC-3 and AsPC-1, pancreatic cancer cells with IC50 ranging between 6-7 μM after 24 h of treatment. Significant autophagy was induced by penfluridol treatment in pancreatic cancer cells. Punctate LC3B and autophagosomes staining confirmed autophagy. Inhibiting autophagy by chloroquine, bafilomycin, 3-methyladenine or LC3BsiRNA, significantly blocked penfluridol-induced apoptosis, suggesting that autophagy lead to apoptosis in our model. Penfluridol treatment suppressed the growth of BxPC-3 tumor xenografts by 48% as compared to 17% when treated in combination with chloroquine. Similarly, penfluridol suppressed the growth of AsPC-1 tumors by 40% versus 16% when given in combination with chloroquine. TUNEL staining and caspase-3 cleavage revealed less apoptosis in the tumors from mice treated with penfluridol and chloroquine as compared to penfluridol alone. Penfluridol treatment also suppressed the growth of orthotopically implanted Panc-1 tumors by 80% by inducing autophagy-mediated apoptosis in the tumors. These studies established that penfluridol inhibits pancreatic tumor growth by autophagy-mediated apoptosis. Since penfluridol is already in clinic, positive findings from our study will accelerate its clinical development.


Figures
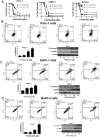
Figure 1
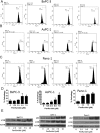
Figure 1. Penfluridol induces apoptosis and suppresses survival of pancreatic cancer cells.
(A) Panc-1, AsPC-1 and BxPC-3 cells were treated with different concentrations of penfluridol for 24, 48 and 72 h. Cell survival was measured by Sulforhodamine B assay to estimate IC50 values. The experiments were repeated three times with 8 replicates in each experiment. (B–D) Approximately 0.3 × 106 Panc-1, AsPC-1 and BxPC-3 cells were plated in 6 well plates, treated with 2.5, 5.0 and 10 μM penfluridol for 24 h and processed for AnnexinV/FITC apoptosis assay using Accuri C6 flow cytometer. Values were plotted as means ± SD. Experiment was repeated three times. *Statistically significant at p ≤ 0.05 when compared with control. Panc-1, AsPC-1 and BxPC-3 cells were treated with varying concentrations of penfluridol for 24 h and processed for western blotting. Representative blots showing concentration-dependent effect of penfluridol treatment on Cl Caspase 3 and Cl PARP. Actin was used as loading control. Shown figure is the representative blots of at least three independent experiments.
Figure 2
Figure 2. Induction of autophagy with penfluridol treatment.
(A–D) BxPC-3, AsPC-1 and Panc-1 cells were plated in six well plates and treated with different concentration of penfluridol for 24 h. Cells were stained with 0.4 μg/ml acridine orange and evaluated by Accuri C6 flow cytometer. Values were plotted as means ± SD. Experiment was repeated three times. *Statistically significant when compared with control at p ≤ 0.05. (E) BxPC-3, AsPC-1 and Panc-1 cells were treated with different concentration of penfluridol for 24 h. Representative blots showing concentration-dependent effect of penfluridol on p62 and LC3B expression. Actin was used as loading control. Figure shown is the representative blots of at least three independent experiments.
Figure 3
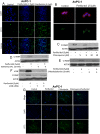
Figure 3. Penfluridol induces autophagy-mediated apoptosis.
(A) AsPC-1 cells were treated with 2.5 and 5.0 μM penfluridol. After 24 h of penfluridol treatment, cells were stained with NucBlue followed by staining with 0.4 μg/ml acridine orange. Images were taken immediately using florescence microscopy. Green florescence represents acridine orange whereas blue represent DAPI. (B) AsPC-1 cells were plated on coverslip. Cells were treated with 2.5 μM penfluridol for 24 h. Cells were processed, mounted on slides and images were taken using florescence microscopy. Green florescence represents LC3B, blue represents DAPI, whereas red represents actin. AsPC-1 cells were treated with penfluridol (5 μM) for 24 h after (C) cells were pretreated with 5 and 10 μM chloroquine for 3 h (D) cells were pretreated with 10 nM BafilomycinA1 for 3 h (E) Cells were pretreated with 5 mM 3-methyladenine for 3 h (F) AsPC-1 cells were transfected with LC3B siRNA. Levels of LC3B and Cl PARP were evaluated by western blotting. Actin was used as loading control. (G) AsPC-1 cells were plated in six well plates and treated with 10 μM chloroquine for 3 h followed by treatment with 5 μM penfluridol for 24 h. Cells nucleus were stained with NucBlue for 20 minutes. Images were taken immediately after adding 50 nM lysotracker green DND-26. Green florescence represents lysosomes whereas blue represent DAPI for nucleus.
Figure 4
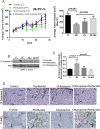
Figure 4. Penfluridol suppresses the growth of subcutaneously implanted BxPC-3 pancreatic tumors by autophagy-mediated apoptosis.
(A) About 1 × 106 BxPC-3 pancreatic cancer cells were injected subcutaneously in flanks of 4–6 week old athymic nude mice. Once tumor volume reached around 70 mm3, mice were randomly divided into 4 groups. Group I received vehicle only and served as control. Group II received 10 mg/kg penfluridol by oral gavage every day. Group III received 50 mg/kg chloroquine (i.p) every day whereas Group IV received 10 mg/kg penfluridol as well as 50 mg/kg chloroquine every day till day 27. Tumors volume was measured twice a week using vernier caliper. Values were plotted as mean ± SEM. Statistically different at p ≤ 0.05 (B) Subcutaneously implanted tumors were removed aseptically after terminating the experiments. Tumors were homogenized, lysed and analyzed for Cl Caspase 3. Actin was used as loading control. Each lane of blot represents tumor from individual mice. (C) Blots were quantitated, normalized with actin and represented as bars. Values were plotted as means ± SEM and considered statistically significant at p ≤ 0.05 (D) Tumors were sectioned and immunostained for Cl Caspase 3 and TUNEL as described in method section.
Figure 5
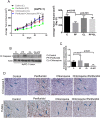
Figure 5. Penfluridol suppresses the growth of subcutaneously implanted AsPC-1 pancreatic tumors by autophagy-mediated apoptosis.
(A) About 1 × 106 AsPC-1 pancreatic cancer cells were injected subcutaneously in flank of 4–6 week old athymic nude mice. Once tumor volume reached around 70 mm3, mice were randomly divided into 4 groups. Group I received vehicle only and served as control. Group II received 10 mg/kg penfluridol by oral gavage every day. Group III received 50 mg/kg chloroquine (i.p) every day whereas Group IV received 10 mg/kg penfluridol as well as 50 mg/kg chloroquine every day till day 27. Tumors volume was measured twice a week using vernier caliper. Values were plotted as mean ± SEM. Statistically different at p ≤ 0.05. (B) Subcutaneously implanted tumors were removed aseptically after terminating the experiments. Tumors were homogenized, lysed and analyzed for Cl Caspase 3. Actin was used as loading control. Each lane of blot represents tumor from individual mice. (C) Blots were quantitated, normalized with actin and represented as bars. Values were plotted as means ± SEM and considered statistically significant at p ≤ 0.05. (D) Tumors were sectioned and immunostained for Cl Caspase 3 and TUNEL as described in method section.
Figure 6
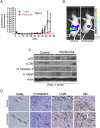
Figure 6. Penfluridol suppresses the growth of orthotopically implanted pancreatic tumor.
About 1 × 106 Panc-1-luc cells were implanted surgically on the pancreas of 4–6 week old athymic nude mice. Mice were treated with 10 mg/kg penfluridol starting day 9th after tumor cells implantation till day 45. (A) Tumor luminescence (photons/second) was measured about thrice a week and plotted against days. (B) Representative mouse from control and penfluridol treated group. After terminating the experiment; pancreas with tumors were removed aseptically, lysed and analyzed for p62, LC3B, Cl Caspase 3 and Cl PARP by western blotting. Actin was used as loading control (C) Each lane of blot represents tumor from separate mouse. (D) Pancreas with tumors were sectioned and immunostained for p62, LC3B, Cl Caspase 3 as well as stained for TUNEL.
Figure 7
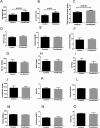
Figure 7. Penfluridol treatment does not cause any major side effect in chronic toxicity model.
About 1 × 106 BxPC-3 cells were implanted subcutaneously on right and left flanks of 4–6 week old female athymic nude mice. Once tumor size was around 70 mm3, 10 mg/kg penfluridol by oral route was administered every day to mice. After 59 days, mice were sacrificed; plasma was collected and sent to Texas Veterinary Medical Diagnostic Laboratory System, Amarillo, TX for analysis. (A) AST (B) ALT (C) Total serum (D) Albumin (E) Calcium (F) Phosphorus (G) Glucose (H) BUN (I) ALP (J) Total Bilirubin (K) A/G ratio (L) Chloride (M) Sodium (N) Potassium (O) Na/k ratio. Values were plotted as means ± SD.

Similar articles

Cited by

References

    1. Kang R. & Tang D. Autophagy in pancreatic cancer pathogenesis and treatment. Am J Cancer Res 2, 383–396 (2012). - PMC - PubMed
    1. Grasso D., Garcia M. N. & Iovanna J. L. Autophagy in pancreatic cancer. Int J Cell Biol 2012, 760498, 10.1155/2012/760498 (2012). - DOI - PMC - PubMed
    1. Papademetrio D. L. et al. Interplay between autophagy and apoptosis in pancreatic tumors in response to gemcitabine. _target Oncol 9, 123–134, 10.1007/s11523-013-0278-5 (2014). - DOI - PubMed
    1. Pardo R. et al. Gemcitabine induces the VMP1-mediated autophagy pathway to promote apoptotic death in human pancreatic cancer cells. Pancreatology 10, 19–26, 10.1159/000264680 (2010). - DOI - PubMed
    1. Kim M. P. & Gallick G. E. Gemcitabine resistance in pancreatic cancer: picking the key players. Clin Cancer Res 14, 1284–1285, 10.1158/1078-0432.CCR-07-2247 (2008). - DOI - PubMed

Publication types

  NODES
admin 4
twitter 2