. 2016 May 18;36(20):5636-49.
doi: 10.1523/JNEUROSCI.3596-15.2016.

Cyclic Nucleotide Control of Microtubule Dynamics for Axon Guidance

Affiliations

Cyclic Nucleotide Control of Microtubule Dynamics for Axon Guidance

Hiroki Akiyama et al. J Neurosci. .

Abstract

Graded distribution of intracellular second messengers, such as Ca(2+) and cyclic nucleotides, mediates directional cell migration, including axon navigational responses to extracellular guidance cues, in the developing nervous system. Elevated concentrations of cAMP or cGMP on one side of the neuronal growth cone induce its attractive or repulsive turning, respectively. Although effector processes downstream of Ca(2+) have been extensively studied, very little is known about the mechanisms that enable cyclic nucleotides to steer migrating cells. Here, we show that asymmetric cyclic nucleotide signaling across the growth cone mediates axon guidance via modulating microtubule dynamics and membrane organelle transport. In embryonic chick dorsal root ganglion neurons in culture, contact of an extending microtubule with the growth cone leading edge induces localized membrane protrusion at the site of microtubule contact. Such a contact-induced protrusion requires exocytosis of vesicle-associated membrane protein 7 (VAMP7)-positive vesicles that have been transported centrifugally along the microtubule. We found that the two cyclic nucleotides counteractively regulate the frequency of microtubule contacts and _targeted delivery of VAMP7 vesicles: cAMP stimulates and cGMP inhibits these events, thereby steering the growth cone in the opposite directions. By contrast, Ca(2+) signals elicit no detectable change in either microtubule contacts or VAMP7 vesicle delivery during Ca(2+)-induced growth cone turning. Our findings clearly demonstrate growth cone steering machinery downstream of cyclic nucleotide signaling and highlight a crucial role of dynamic microtubules in leading-edge protrusion for cell chemotaxis.

Significance statement: Developing neurons can extend long axons toward their postsynaptic _targets. The tip of each axon, called the growth cone, recognizes extracellular guidance cues and navigates the axon along the correct path. Here we show that asymmetric cyclic nucleotide signaling across the growth cone mediates axon guidance through localized regulation of microtubule dynamics and resulting recruitment of specific populations of membrane vesicles to the growth cone's leading edge. Remarkably, cAMP stimulates microtubule growth and membrane protrusion, whereas cGMP promotes microtubule retraction and membrane senescence, explaining the opposite directional polarities of growth cone turning induced by these cyclic nucleotides. This study reveals a novel microtubule-based mechanism through which cyclic nucleotides polarize the growth cone steering machinery for bidirectional axon guidance.

Keywords: VAMP7; axon guidance; cyclic nucleotide; growth cone; microtubule.


Figures

Figure 1.
Figure 1.
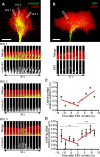
MT contact precedes lamellipodial protrusion. A, A TIRF image of a growth cone expressing EGFP-α-tubulin (green) and mCherry-CAAX (red). Lower panels are magnified time-lapse images of ROIs 1–3 (white rectangles in the top). The ROIs 1 and 3 represent the leading edge with MT contact, whereas the ROI 2 represents the leading edge without MT contact. B, Fluorescence image of a growth cone expressing EGFP-EB1 (green) and mCherry-CAAX (red). Lower panels are magnified time-lapse views of the white boxed region in the upper panel. Scale bars, 5 μm. C, The leading-edge position in the white boxed region of the growth cone shown in B was plotted against the time after EB1 contact with the leading edge. The leading-edge position at the time of EB1 contact was set zero, and positive values in the y-axis represent edge protrusion. The speed of edge protrusion before and after EB1 contact was estimated by determining the regression lines using five each. D, Averaged time course changes of the leading-edge position and the regression lines after EB1 contact in the growth cone shown in B (n = 27 events). Changes of the leading-edge position were analyzed statistically. ***p < 0.001; ns, not significant, repeated-measures one-way ANOVA.
Figure 2.
Figure 2.
Centrifugal transport of VAMP7 vesicles correlates with MT extension. A, A TIRF image of a growth cone expressing EGFP-α-tubulin (green) and mCherry-VAMP7 (red). The blue line depicts the growth cone outline. Right panels are magnified time-lapse views of the boxed region in the left panel. The arrowheads indicate a VAMP7 vesicle migrating centrifugally along an MT. Scale bar, 5 μm. B, Correlation of the number of VAMP7 vesicles migrating centrifugally with that of EB1 comets migrating into the P domain. To negate potential effect of different growth cone size, the number of vesicles and comets on this graph had been divided by the length of the C-domain/P-domain boundary. Each diamond represents a single growth cone, and the red line shows the regression line [n = 41 growth cones, Pearson's correlation coefficient (r) = 0.83, p < 0.0001]. C, The number of VAMP7 vesicles migrating centrifugally was counted before (pre) and 10 min after (post) treatment with DMSO or nocodazole. Each line represent a drug-induced change in a single growth cone. **p < 0.01; ns, not significant, paired t test.
Figure 3.
Figure 3.
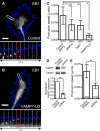
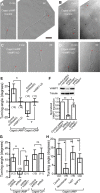
MT-induced lamellipodial protrusion depends on VAMP7. A, B, Fluorescence images of EGFP-EB1 in growth cones that coexpress either BFP (A) or BFP-tagged VAMP7-LD (B). The blue lines depict the growth cone outline. Lower panels are the magnified time-lapse images of white boxed regions in the corresponding upper panels. The red rectangles highlight time-lapse frames of EB1 contacts with the leading edge. Scale bars, 5 μm. C, The mean speed of leading-edge protrusion after EB1 contact in growth cones transfected or treated with the indicated constructs or drugs. Numbers in parentheses indicate the number of EB1 contact events examined. *p < 0.05; ns, not significant, unpaired or Welch's t test with Holm–Bonferroni correction. D, The effect of VAMP7 shRNA on endogenous VAMP7 expression in DF-1 cells. Upper panels show immunoblots of VAMP7 and tubulin as a control. A graph represents VAMP7/tubulin normalized to that in control shRNA (n = 3 independent experiments). **p < 0.01, paired t test. E, The mean speed of leading-edge protrusion after EB1 contact in growth cones treated with control or VAMP7 shRNA. *p < 0.05, Welch's t test.
Figure 4.
Figure 4.
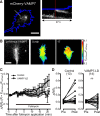
Lamellipodial protrusion upon VAMP7 contact with the leading edge. A, A fluorescence image of mCherry-VAMP7 in a growth cone. Right panel is a kymograph along the white line shown in the left panel. The red line in the kymograph corresponds to the timing of VAMP7 contact with the leading edge. Scale bar, 5 μm. B, A fluorescence image of a growth cone expressing pHVenus-VAMP7. Time-lapse pseudo-color images represent pHVenus/mCherry emission ratio (R) before (left) and after (right) bath application of folimycin. Digits indicate minutes after folimycin application. Scale bar, 10 μm. C, Time course changes in R in growth cones expressing BFP (filled circle) or BFP-tagged VAMP7-LD (open circle). The y-axis indicates ΔR/R0, where R0 is the mean of R values before folimycin application and ΔR represents RR0. D, The ΔR/R0 values were compared between 0 min (pre) and 21 min (post) after bath application of folimycin. Each line represents folimycin-induced ΔR/R0 changes in a single growth cone. Numbers in parentheses indicate the number of growth cones examined. *p < 0.05; ns, not significant, paired t test.
Figure 5.
Figure 5.
cAMP and cGMP counteractively regulate MT distribution into the P domain. A–C, Immunofluorescence showing MT distribution in growth cones treated for 30 min with 20 μm 8Br-cGMP (A), 20 μm 8Br-cGMP and 20 μm Sp-cAMPS (B), or 20 μm Sp-cAMPS (C). Scale bar, 10 μm. D, The total length of MTs in the P domain of growth cones cotreated with the indicated doses of Sp-cAMPS and 8Br-cGMP. Numbers in parentheses indicate the number of growth cones examined. *p < 0.05, **p < 0.01, ***p < 0.001; ns, not significant, unpaired or Welch's t test with Holm–Bonferroni correction.
Figure 6.
Figure 6.
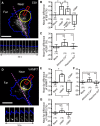
cAMP and cGMP counteractively regulate MT-guided transport of VAMP7 vesicles. A, A TIRF image of EGFP-EB1 in a growth cone outlined in blue. Caged cAMP was photolyzed by UV irradiation (yellow circle), and the behavior of EB1 comets was analyzed on the UV-irradiated side (Near) and the opposite side (Far). The pink broken line indicates the boundary between Near and Far. Lower panels are the magnified time-lapse images of the red boxed region in the upper panel. B, C, The effect of photolysis-induced cyclic nucleotide (B) and Ca2+ (C) signals on MT extension in growth cones. The number of EB1 comets contacting the leading edge on the near or far side was divided by the length of the C-domain/P-domain boundary on the corresponding side. Shown is the mean of near–far differences of EB1 contact frequency calculated as (near − far)/(near + far) × 100, with positive and negative values indicating more frequent EB1 contact on the near and far sides, respectively. Caged compound loading was omitted in “Blank.” Numbers in parentheses indicate the number of growth cones examined. *p < 0.05; ns, not significant; B, unpaired t test with Holm–Bonferroni correction; C, Dunnett's multiple-comparison test. D, A fluorescence image of mRFP-VAMP7 in a growth cone. The behavior of VAMP7 vesicles was analyzed after photolyzing caged cAMP (yellow circle). The pink broken line indicates the boundary between Near and Far. Lower panels are the magnified time-lapse images of the red boxed region in the upper panel. Scale bars, 10 μm. The number of VAMP7 (E, F) or VAMP2 (G) vesicles migrating centrifugally on either side was counted and divided by the length of C-domain/P-domain boundary. *p < 0.05; ns, not significant, Dunnett's multiple-comparison test.
Figure 7.
Figure 7.
VAMP7 is necessary for cyclic nucleotide-induced growth cone turning. A–D, Time-lapse differential interference contrast images of growth cones transfected with mWasabi (A, B) or mWasabi-tagged VAMP7-LD (C, D) constructs and then loaded with caged cAMP (A, C) or caged cGMP (B, D). Caged compounds were photolyzed by repetitive FLIP on one side of the growth cone (red spots). Digits represent minutes after the start of repetitive FLIP. Scale bar, 10 μm. E, The average angle of growth cone turning induced by FLIP of caged cAMP or cGMP. The growth cones express either mWasabi (control) or mWasabi-tagged VAMP7-LD. Positive and negative values on the y-axis indicate attractive and repulsive turning, respectively. Numbers in parentheses indicate the number of growth cones examined. *p < 0.05, unpaired t test. F, The effect of VAMP7 shRNA on the expression of exogenous VAMP7 of wild-type (wtVAMP7) or shRNA-resistant sequence (VAMP7*) in DRG neurons. Upper panels show immunoblots of VAMP7 and tubulin as a control. A graph represents VAMP7/tubulin normalized to that in control shRNA (n = 3 independent experiments). *p < 0.05, **p < 0.01, paired t test with Holm–Bonferroni correction. G, H, The average angle of growth cone turning induced by FLIP of caged cAMP or caged Ca2+. The growth cones were genetically or pharmacologically pretreated as indicated. *p < 0.05, Dunnett's multiple-comparison test (G, caged cAMP); ns, not significant, unpaired t test (G, caged Ca2+), *p < 0.05; ns, not significant, Dunnett's multiple-comparison test (H).
Figure 8.
Figure 8.
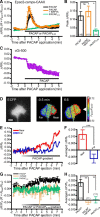
PACAP gradients elicit asymmetric cAMP elevation across the growth cone. A, Time course changes in FRET efficiency (ECFP/EYFP emission ratio defined as R) of Epac2-camps-CAAX in growth cones exposed to bath-applied PACAP or PACAP6-38. The y-axis indicates ΔR/R0, where R0 is the mean of R values before the application of PACAP or PACAP6-38 and ΔR represents RR0. B, The peak ΔR/R0 after bath application of PACAP or PACAP6−38 in growth cones shown in A. Some growth cones were loaded with BAPTA-AM before PACAP application. Numbers in parentheses indicate the number of growth cones examined. *p < 0.05; ns, not significant, unpaired or Welch's t test with Holm–Bonferroni correction. C, Time course changes in FRET efficiency (ECFP/EYFP emission ratio defined as R) of cGi-500 in growth cones exposed to bath-applied PACAP (n = 5 growth cones). D, A fluorescence image of a growth cone expressing Epac2-camps-CAAX. Time-lapse pseudo-color images represent R before (left) and after (right) directional application of a PACAP gradient (arrowhead). ROIs used to calculate R on both sides of the growth cone are shown (Near and Far). Digits indicate minutes after the onset of a PACAP gradient. Scale bar, 10 μm. E, Time course changes in R in the near (red) and far (blue) ROIs of the growth cone shown in D. F, The mean ΔR/R0 during the period from 1 to 7.5 min after the onset of PACAP gradient in the near and far ROIs (n = 11 growth cones). ***p < 0.001, paired t test. G, Growth cones pretreated with or without NF449 were exposed to a PACAP or PACAP6-38 gradient. Shown are time course changes in R′, where R′ is a ratio of R in the near ROI (RNear) to that in the far ROI (RFar). Note that R′ is an index of asymmetric cAMP elevations across the growth cone. H, The mean ΔR′/R′0 in growth cones shown in G during the period from 1 to 7.5 min after the onset of PACAP or PACAP6-38 gradient. **p < 0.01, Dunnett's multiple-comparison test.
Figure 9.
Figure 9.
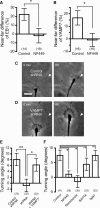
VAMP7-dependent membrane trafficking operates in PACAP-induced growth cone attraction. A, Growth cones were exposed to PACAP gradients, and the number of EB1 comets contacting the leading edge was counted on the near and far sides. Shown is the mean of near–far differences of EB1 contact frequency calculated as (near − far)/(near + far) × 100 in the absence (control) or presence of NF449. Numbers in parentheses indicate the number of growth cones examined. *p < 0.05, unpaired t test. B, Growth cones were exposed to PACAP gradients, and the number of VAMP7 vesicles migrating centrifugally was counted on the near and far sides. Shown is the mean of near–far differences of frequency of VAMP7 vesicle centrifugal transport in the absence (control) or presence of NF449. *p < 0.05, unpaired t test. C, D, Time-lapse phase contrast images of growth cones treated with control (C) or VAMP7 shRNA (D). White arrowheads indicate the direction of PACAP gradients. Digits represent minutes after the onset of PACAP gradients. Scale bar, 10 μm. E, F, The average angles of growth cone turning induced by PACAP gradients. The growth cones were genetically or pharmacologically treated as indicated. VAMP7* is an shRNA-resistant VAMP7. E, *p < 0.05; **p < 0.01, Dunnett's multiple-comparison test; F, *p < 0.05; ns, not significant, unpaired or Welch's t test with Holm–Bonferroni correction.
Figure 10.
Figure 10.
Schematic illustration of MT-guided membrane vesicle transport. Orange areas represent second-messenger signals mediating growth cone turning. Cyclic nucleotides counteractively regulate VAMP7 vesicle transport along polymerizing MTs: cAMP (left) and cGMP (middle) facilitates and inhibits this effector process, thereby causing attraction and repulsion, respectively. By contrast, attractive Ca2+ signals (right) promote VAMP2 vesicle transport along pre-existing MTs. Blue arrows indicate the direction of growth cone turning. The graph below each growth cone scheme shows the activity of centrifugal movement of membrane vesicles and MTs across the width of the growth cone.

Similar articles

Cited by

References

    1. Akhmanova A, Steinmetz MO. Tracking the ends: a dynamic protein network controls the fate of microtubule tips. Nat Rev Mol Cell Biol. 2008;9:309–322. doi: 10.1038/nrm2369. - DOI - PubMed
    1. Akiyama H, Kamiguchi H. Phosphatidylinositol 3-kinase facilitates microtubule-dependent membrane transport for neuronal growth cone guidance. J Biol Chem. 2010;285:41740–41748. doi: 10.1074/jbc.M110.156489. - DOI - PMC - PubMed
    1. Akiyama H, Kamiguchi H. Analysis of calcium signals in steering neuronal growth cones in vitro. Methods Mol Biol. 2014;1162:17–27. doi: 10.1007/978-1-4939-0777-9_2. - DOI - PubMed
    1. Akiyama H, Kamiguchi H. Second messenger networks for accurate growth cone guidance. Dev Neurobiol. 2015;75:411–422. doi: 10.1002/dneu.22157. - DOI - PubMed
    1. Akiyama H, Matsu-ura T, Mikoshiba K, Kamiguchi H. Control of neuronal growth cone navigation by asymmetric inositol 1,4,5-trisphosphate signals. Sci Signal. 2009;2:ra34. doi: 10.1126/scisignal.2000196. - DOI - PubMed

Publication types

LinkOut - more resources

  NODES
Note 1
twitter 2