The Small G Protein AtRAN1 Regulates Vegetative Growth and Stress Tolerance in Arabidopsis thaliana
- PMID: 27258048
- PMCID: PMC4892486
- DOI: 10.1371/journal.pone.0154787
The Small G Protein AtRAN1 Regulates Vegetative Growth and Stress Tolerance in Arabidopsis thaliana
Abstract
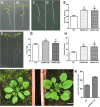
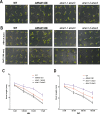
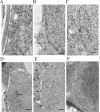
The evolutionarily conserved small G-protein Ran plays important role in nuclear translocation of proteins, cell cycle regulation, and nuclear envelope maintenance in mammalian cells and yeast. Arabidopsis Ran proteins are encoded by a family of four genes and are highly conserved at the protein level. However, their biological functions are poorly understood. We report here that AtRAN1 plays an important role in vegetative growth and the molecular improvement of stress tolerance in Arabidopsis. AtRAN1 overexpression promoted vegetative growth and enhanced abiotic tolerance, while the atran1 atran3 double mutant showed higher freezing sensitivity than WT. The AtRAN1 gene is ubiquitously expressed in plants, and the expression levels are higher in the buds, flowers and siliques. Subcellular localization results showed that AtRAN1 is mainly localized in the nucleus, with some present in the cytoplasm. AtRAN1 could maintain cell division and cell cycle progression and promote the formation of an intact nuclear envelope, especially under freezing conditions.
Conflict of interest statement
Figures


Similar articles
-
Overexpression of a small GTP-binding protein Ran1 in Arabidopsis leads to promoted elongation growth and enhanced disease resistance against P. syringae DC3000.Plant J. 2021 Nov;108(4):977-991. doi: 10.1111/tpj.15445. Epub 2021 Oct 28. Plant J. 2021. PMID: 34312926
-
Ran-GTP/-GDP-dependent nuclear accumulation of NONEXPRESSOR OF PATHOGENESIS-RELATED GENES1 and TGACG-BINDING FACTOR2 controls salicylic acid-induced leaf senescence.Plant Physiol. 2022 Jun 27;189(3):1774-1793. doi: 10.1093/plphys/kiac164. Plant Physiol. 2022. PMID: 35417014 Free PMC article.
-
The Arabidopsis small G-protein AtRAN1 is a positive regulator in chitin-induced stomatal closure and disease resistance.Mol Plant Pathol. 2021 Jan;22(1):92-107. doi: 10.1111/mpp.13010. Epub 2020 Nov 15. Mol Plant Pathol. 2021. PMID: 33191557 Free PMC article.
-
Soybean NAC transcription factors promote abiotic stress tolerance and lateral root formation in transgenic plants.Plant J. 2011 Oct;68(2):302-13. doi: 10.1111/j.1365-313X.2011.04687.x. Epub 2011 Jul 26. Plant J. 2011. PMID: 21707801
-
Overexpression of an Arabidopsis heterogeneous nuclear ribonucleoprotein gene, AtRNP1, affects plant growth and reduces plant tolerance to drought and salt stresses.Biochem Biophys Res Commun. 2016 Apr 1;472(2):353-9. doi: 10.1016/j.bbrc.2016.02.081. Epub 2016 Feb 26. Biochem Biophys Res Commun. 2016. PMID: 26923071
Cited by
-
Drought stress tolerance mechanisms and their potential common indicators to salinity, insights from the wild watermelon (Citrullus lanatus): A review.Front Plant Sci. 2023 Feb 6;13:1074395. doi: 10.3389/fpls.2022.1074395. eCollection 2022. Front Plant Sci. 2023. PMID: 36815012 Free PMC article. Review.
-
Association Mapping of Drought Tolerance Indices in Ethiopian Durum Wheat (Triticum turgidum ssp. durum).Front Plant Sci. 2022 May 26;13:838088. doi: 10.3389/fpls.2022.838088. eCollection 2022. Front Plant Sci. 2022. PMID: 35693182 Free PMC article.
-
DEFECTIVE EMBRYO AND MERISTEMS genes are required for cell division and gamete viability in Arabidopsis.PLoS Genet. 2021 May 17;17(5):e1009561. doi: 10.1371/journal.pgen.1009561. eCollection 2021 May. PLoS Genet. 2021. PMID: 33999950 Free PMC article.
-
Function of Brassica napus BnABI3 in Arabidopsis gs1, an Allele of AtABI3, in Seed Development and Stress Response.Front Plant Sci. 2019 Feb 5;10:67. doi: 10.3389/fpls.2019.00067. eCollection 2019. Front Plant Sci. 2019. PMID: 30804960 Free PMC article.
-
Genome-wide identification of Ran GTPase family genes from wheat (T. aestivum) and their expression profile during developmental stages and abiotic stress conditions.Funct Integr Genomics. 2021 Mar;21(2):239-250. doi: 10.1007/s10142-021-00773-0. Epub 2021 Feb 20. Funct Integr Genomics. 2021. PMID: 33609188
References
MeSH terms
Substances
Grants and funding
LinkOut - more resources
Full Text Sources
Other Literature Sources
Molecular Biology Databases
Miscellaneous

