. 2016 Jun 28;12(6):e1005702.
doi: 10.1371/journal.ppat.1005702. eCollection 2016 Jun.

Two Escape Mechanisms of Influenza A Virus to a Broadly Neutralizing Stalk-Binding Antibody

Affiliations

Two Escape Mechanisms of Influenza A Virus to a Broadly Neutralizing Stalk-Binding Antibody

Ning Chai et al. PLoS Pathog. .

Abstract

Broadly neutralizing antibodies _targeting the stalk region of influenza A virus (IAV) hemagglutinin (HA) are effective in blocking virus infection both in vitro and in vivo. The highly conserved epitopes recognized by these antibodies are critical for the membrane fusion function of HA and therefore less likely to be permissive for virus mutational escape. Here we report three resistant viruses of the A/Perth/16/2009 strain that were selected in the presence of a broadly neutralizing stalk-binding antibody. The three resistant viruses harbor three different mutations in the HA stalk: (1) Gln387Lys; (2) Asp391Tyr; (3) Asp391Gly. The Gln387Lys mutation completely abolishes binding of the antibody to the HA stalk epitope. The other two mutations, Asp391Tyr and Asp391Gly, do not affect antibody binding at neutral pH and only slightly reduce binding at low pH. Interestingly, they enhance the fusion ability of the HA, representing a novel mechanism that allows productive membrane fusion even in the presence of antibody and hence virus escape from antibody neutralization. Therefore, these mutations illustrate two different resistance mechanisms used by IAV to escape broadly neutralizing stalk-binding antibodies. Compared to the wild type virus, the resistant viruses release fewer progeny viral particles during replication and are more sensitive to Tamiflu, suggesting reduced viral fitness.


Conflict of interest statement

I have read the journal's policy and the authors of this manuscript have the following competing interests: NC, MR, EL, AF, PL, and MWT are employees of Genentech; LRS is an employee of Achaogen. This does not alter our adherence to all PLoS Pathogens policies on sharing data and materials.

Figures
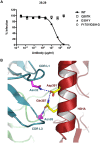
Fig 1
Fig 1. Viruses resistant to mAb 39.29.
(A) Micro-neutralization assay was performed on MDCK cells in 96-well plates. WT and mutant A/Perth/16/2009 viruses were incubated with serial dilutions of 39.29 ranging from 0.0032 to 250 μg/ml. Cells were incubated with the virus-antibody mixture for 16 hours prior to immuno-staining with anti-IAV NP and Hoechst 33342. The percentages of infected cells for each virus were normalized to the value at the lowest antibody concentration. The assay was done in triplicate with data presented as Mean +/- SEM (standard error of the mean). (B) The structure is generated from PDB ID, 4KVN with PYMOL. The stalk of A/Perth/16/2009 HA is in red, the light chain of 39.29 Fab is in blue, and the heavy chain is in green. Amino acid side chains for Asn32 (in CDR L1) and Asn93 (in CDR L3) of the light chain, and Asp391 and Gln387 of the HA are represented as sticks.
Fig 2
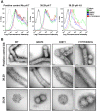
Fig 2. Differential binding properties of the mutants to 39.29.
(A) 293T cells expressing the WT or mutant A/Perth/16/2009 HAs were incubated with a positive control antibody (left panel) or 39.29 (middle and right panels) at pH 7 (left and middle panels) or 4.8 (right panel). Flow cytometry profiles are shown. Mock, mock transfected cells. (B) Immunogold EM images of the WT and mutant A/Perth/16/2009 viruses bound by a positive control antibody (top panel with 6 nm gold conjugate) or 39.29 (middle and bottom panels, showing filamentous and spherical particles respectively, with 10 nm gold conjugate). Scale bar is 50 nm. Note the loss of binding of 39.29 to Q387 particles.
Fig 3
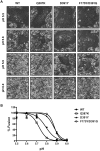
Fig 3. Differential membrane fusion properties of WT and mutant HAs.
(A) Hela cells expressing the WT or mutant A/Perth/16/2009 HAs were treated with trypsin to activate HA0 and then incubated with buffers at different pHs for 2 minutes to induce cell-cell fusion. After overnight culture, representative images were obtained under a phase contrast microscope. Note the dramatic difference between the WT and mutant HAs at pH 5.8 and 5.9. (B) Hela cells expressing the WT or mutant A/Perth/16/2009 HAs plus a tetracycline (Tet)-inducible luciferase protein were mixed with Hela Tet-On 3G cells expressing the WT or mutant HAs. Fusion was induced as in (A). After overnight culture, cells were lysed and incubated with a luminescent substrate of the luciferase. Luminescence signals were measured and normalized to the value at pH 5.5 for each HA. The percentages of fusion were plotted at various pH values and the data were fit with a nonlinear regression dose response curve. The assay was done in triplicate with data presented as Mean +/- SEM.
Fig 4
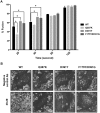
Fig 4. Fusion kinetics of WT and mutant HAs and sensitivity to 39.29.
(A) Hela cells expressing the WT or mutant A/Perth/16/2009 HAs plus a tetracycline (Tet)-inducible luciferase protein were mixed with Hela Tet-On 3G cells expressing the WT or mutant HAs. Cells were treated with trypsin to activate HA0 and then incubated with a buffer of pH 5.7 for 20, 40, 60 or 120 seconds to induce cell-cell fusion. After overnight culture, cells were lysed and incubated with a luminescent substrate of the luciferase. Luminescence signals were measured and normalized to the largest value at 120 second for each HA. The percentages of fusion are shown as histograms at each time point. The assay was done in triplicate with data presented as Mean +/- SEM. Statistics were calculated between WT and each of the mutants using a multiple t test with the GraphPad Prism v.6.0 software (* P ≤ 0.05, indicating significant difference). (B) Hela cells expressing the WT or mutant A/Perth/16/2009 HAs were treated with trypsin to activate HA0 and then incubated with either 39.29 or a negative control antibody before pH drop to 5.5 to induce cell-cell fusion. After overnight culture, representative images were obtained under a phase contrast microscope. 39.29 was able to block the fusion mediated by the WT HA but not the mutant HAs.
Fig 5
Fig 5. 39.39 blocks the low-pH induced conformational change of the WT HA but not the mutant HAs.
293T cells expressing the Q387K, D391Y, F175Y/D391G or WT A/Perth/16/2009 HA were collected before (Stage 1) or after (Stage 2) trypsin treatment to activate HA0. A fraction of trypsin-treated cells were incubated with 39.29 and then subjected to a pH4.8 buffer to induce HA conformational change (Stage 3). Cells at each stage were tested for 39.29 binding by flow cytometry. The mean fluorescence intensities were normalized to the WT and the percentages of binding are shown as histograms. The possible HA conformations at each stage are depicted above the binding data. HA1 is in blue and HA2 is in red. Mock, mock transfected cells.
Fig 6
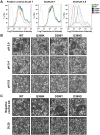
Fig 6. Binding and fusion properties of the Q386K, D390Y and D390G mutant HAs of A/California/7/2009.
The Q387K, D391Y and D391G mutations of the A/Perth/16/2009 resistant viruses were introduced into the corresponding residues of the A/California/7/2009 HA to generate the Q386K, D390Y and D390G mutant HAs. (A) 293T cells expressing the WT or mutant A/California/7/2009 HAs were incubated with a positive control antibody (left panel) or 39.29 (middle and right panels) at pH 7 (left and middle panels) or 4.8 (right panel). Flow cytometry profiles are shown. Mock, mock transfected cells. (B) Hela cells expressing the WT or mutant A/California/7/2009 HAs were treated with trypsin to activate HA0 and then incubated with buffers at different pHs for 2 minutes to induce cell-cell fusion. After overnight culture, representative images were obtained under a phase contrast microscope. (C) Hela cells expressing the WT or mutant A/California/7/2009 HAs were treated with trypsin to activate HA0 and then incubated with either 39.29 or a negative control antibody before pH drop to 4.8 to induce cell-cell fusion. After overnight culture, representative images were obtained under a phase contrast microscope. 39.29 was able to block fusion mediated by either the WT or the mutant HAs.
Fig 7
Fig 7. The G234E mutant HA of A/Perth/16/2009 binds and is blocked by 39.29 as well as the WT HA.
(A) 293T cells expressing the WT or G234E A/Perth/16/2009 HA were incubated with a positive control antibody (left panel) or 39.29 (middle and right panels) at pH 7 (left and middle panels) or 4.8 (right panel). Flow cytometry profiles are shown. Mock, mock transfected cells. (B) Hela cells expressing the WT or G234E A/Perth/16/2009 HA were treated with trypsin to activate HA0 and then incubated with either 39.29 or a negative control antibody before pH drop to 5.4 to induce maximal cell-cell fusion. After overnight culture, representative images were obtained under a phase contrast microscope. 39.29 was able to block the fusion mediated by the G234E mutant HA.
Fig 8
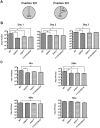
Fig 8. Reduced viral fitness of the A/Perth/16/2009 resistant viruses.
(A) A multiple sequence alignment of 11,981 HA amino acid sequences from human and zoonotic isolates of the H1–16 subtypes was used to assess the genetic diversity at positions corresponding to H3 HA 387 and 391. The results are shown as pie charts. (B) In vitro fitness. MDCK cells were infected with the WT or 39.29-resistant A/Perth/16/2009 viruses at MOI 0.01. Released viral genome in the supernatant was quantitated daily by qPCR of the viral M1 Matrix gene. Genome copy numbers per 50 μl of supernatant are shown as histograms. The assay was done in triplicate with data presented as Mean +/- SEM. Statistics were calculated between WT and each of the mutant viruses using a multiple t test with the Prism 6.0 software (* P ≤ 0.05, indicating significant difference). (C) In vivo fitness. DBA/2J mice were infected with same dose of WT or 39.29-resistant A/Perth/16/2009 viruses. At 6 hr, 24 hr, 48 hr and 72 hr post-infection, lung homogenates were prepared and viral titers in the homogenates were determined on MDCK cells. Each group at each time point contained 5 mice. Lung titers were presented as Mean +/- SEM. Statistics were calculated between WT and each of the mutant viruses using a multiple t test with the Prism 6.0 software (* P ≤ 0.05, indicating significant difference).
Fig 9
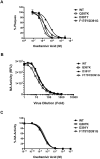
Fig 9. Effect of oseltamivir acid on A/Perth/16/2009 WT and mutant viruses.
(A) Plaque reduction assay. MDCK cells in 6-well plates were infected with the WT or 39.29-resistant A/Perth/16/2009 viruses at 100 pfu/well for 1 hour. After removal of the virus inoculum, cells were overlaid with varying concentrations of oseltamivir acid in agarose. The numbers of plaques were counted for each virus and normalized to the number at the lowest oseltamivir acid concentration. The assay was done in triplicate with data presented as Mean +/- SEM. (B) Neuraminidase (NA) activity assay. Serial dilutions of the WT and 39.29-resistant viruses were incubated with a fluorescent NA substrate. NA activities as a function of the fluorescence intensities in relative fluorescence unit (RFU) were plotted on the y-axis versus the log10 virus dilutions on the x-axis. The assay was done in duplicate with data presented as Mean +/- SEM. (C) Virus dilutions with equal NA activities were incubated with varying concentrations of oseltamivir acid, followed by NA activity determination with the fluorescent NA substrate. The NA activities of each virus were normalized to the value at the lowest oseltamivir acid concentration. The assay was done in duplicate with data presented as Mean +/- SEM.

Similar articles

Cited by

References

    1. Lozano R, Naghavi M, Foreman K, Lim S, Shibuya K, et al. (2012) Global and regional mortality from 235 causes of death for 20 age groups in 1990 and 2010: a systematic analysis for the Global Burden of Disease Study 2010. Lancet 380: 2095–2128. 10.1016/S0140-6736(12)61728-0 - DOI - PMC - PubMed
    1. Thompson WW, Shay DK, Weintraub E, Brammer L, Cox N, et al. (2003) Mortality associated with influenza and respiratory syncytial virus in the United States. JAMA 289: 179–186. - PubMed
    1. Thompson WW, Shay DK, Weintraub E, Brammer L, Bridges CB, et al. (2004) Influenza-associated hospitalizations in the United States. JAMA 292: 1333–1340. - PubMed
    1. Murray CJ, Lopez AD, Chin B, Feehan D, Hill KH (2006) Estimation of potential global pandemic influenza mortality on the basis of vital registry data from the 1918–20 pandemic: a quantitative analysis. Lancet 368: 2211–2218. - PubMed
    1. Pebody R, Warburton F, Ellis J, Andrews N, Thompson C, et al. (2015) Low effectiveness of seasonal influenza vaccine in preventing laboratory-confirmed influenza in primary care in the United Kingdom: 2014/15 mid-season results. Euro Surveill 20. - PubMed

Substances

Grants and funding

The authors received no specific funding for this study.
  NODES
Note 2
twitter 2