. 2016 Oct 13;128(15):1944-1958.
doi: 10.1182/blood-2016-04-708750. Epub 2016 Aug 18.

_targeting FLT3-ITD signaling mediates ceramide-dependent mitophagy and attenuates drug resistance in AML

Affiliations

_targeting FLT3-ITD signaling mediates ceramide-dependent mitophagy and attenuates drug resistance in AML

Mohammed Dany et al. Blood. .

Abstract

Signaling pathways regulated by mutant Fms-like tyrosine kinase 3 (FLT3)-internal tandem duplication (ITD), which mediate resistance to acute myeloid leukemia (AML) cell death, are poorly understood. Here, we reveal that pro-cell death lipid ceramide generation is suppressed by FLT3-ITD signaling. Molecular or pharmacologic inhibition of FLT3-ITD reactivated ceramide synthesis, selectively inducing mitophagy and AML cell death. Mechanistically, FLT3-ITD _targeting induced ceramide accumulation on the outer mitochondrial membrane, which then directly bound autophagy-inducing light chain 3 (LC3), involving its I35 and F52 residues, to recruit autophagosomes for execution of lethal mitophagy. Short hairpin RNA (shRNA)-mediated knockdown of LC3 prevented AML cell death in response to FLT3-ITD inhibition by crenolanib, which was restored by wild-type (WT)-LC3, but not mutants of LC3 with altered ceramide binding (I35A-LC3 or F52A-LC3). Mitochondrial ceramide accumulation and lethal mitophagy induction in response to FLT3-ITD _targeting was mediated by dynamin-related protein 1 (Drp1) activation via inhibition of protein kinase A-regulated S637 phosphorylation, resulting in mitochondrial fission. Inhibition of Drp1 prevented ceramide-dependent lethal mitophagy, and reconstitution of WT-Drp1 or phospho-null S637A-Drp1 but not its inactive phospho-mimic mutant (S637D-Drp1), restored mitochondrial fission and mitophagy in response to crenolanib in FLT3-ITD+ AML cells expressing stable shRNA against endogenous Drp1. Moreover, activating FLT3-ITD signaling in crenolanib-resistant AML cells suppressed ceramide-dependent mitophagy and prevented cell death. FLT3-ITD+ AML drug resistance is attenuated by LCL-461, a mitochondria-_targeted ceramide analog drug, in vivo, which also induced lethal mitophagy in human AML blasts with clinically relevant FLT3 mutations. Thus, these data reveal a novel mechanism which regulates AML cell death by ceramide-dependent mitophagy in response to FLT3-ITD _targeting.


Figures

Figure 1
Figure 1
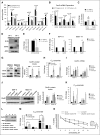
Reactivation of CerS1-C18-ceramide axis is required for the response of AML cells to FLT3-_targeted therapy. (A) MS high-performance liquid chromatography (HPLC)-MS-MS analysis for the different ceramide species in FLT3+ vs FLT3 CD34+ AML blasts obtained from bone marrow of AML patients. (B) Quantitative polymerase chain reaction (qPCR) measurement of CerSs mRNA expression in FLT3+ vs FLT3 CD34+ AML blasts obtained from bone marrow of AML patients. (C) CerS1 mRNA in TF-1 cells transfected with FLT3-ITD overexpression vector. (D) Western blot for CerS1 protein in TF-1 cells transfected with FLT3-ITD overexpression vector. (E) HPLC-MS-MS measurement of C18-ceramide in TF-1 cells transfected with FLT3-ITD overexpression vector. (F) qPCR measuring CerS1 mRNA in cells transfected with FLT3 small interfering RNA (siRNA). (G) qPCR measuring CerS1 mRNA in cells treated with FLT3 pharmacological inhibitors. (H) Western blotting measuring CerS1 protein in cells transfected with FLT3 siRNA. (I) Western blotting measuring CerS1 protein in cells treated with FLT3 pharmacological inhibitors. (J) HPLC-MS-MS measuring C18-ceramide in cells transfected with FLT3 siRNA. (K) HPLC-MS-MS measuring C18-ceramide in cells treated with FLT3 pharmacological inhibitors. (L) Western blot to detect CerS1 protein in sh-CerS1 cells reconstituted with CerS1 WT or CerS1-H138A catalytically inactive mutant. (M) HPLC-MS-MS measurement of C18-cermide in crenolanib-treated cells transfected with CerS1 WT or CerS1-H138A catalytically inactive mutant. (N) Percentage of viability measured using MTT (3-(4,5-dimethylthiazol-2-yl)-2,5-dimethyltetrazolium bromide) assay for sh-scr, sh-CerS1, sh-CerS1+CerS1 WT, and sh-CerS1+CerS1 H1338A mutant, treated with crenolanib. Values indicate mean ± standard deviation (SD) of n = 3 independent experiments. *P value of <.05 using the 2-sided Student t test.
Figure 2
Figure 2
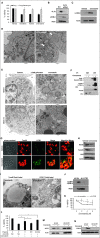
Inhibition of FLT3 induces mitophagy. (A) MV4-11 cells are pretreated with bafilomycin, inhibitor of autophagy, followed by treatment with 10 μM sorafenib, 10 μM AC220, or 5 μM crenolanib for 24 hours. Cell viability is measured using the MTT assay. (B) Western blot to detect LC3B-I (top band) and LC3B-II (bottom band) in MV4-11 cells transfected with FLT3 siRNA. (C) Western blot measuring LC3B in cells treated with crenolanib FLT3 inhibitor. (D) MV4-11 cells were transfected with FLT3 siRNA and visualized for morphology. White arrows indicate autophagosomes. (E) MV4-11 or Molm-14 cells were treated with crenolanib and gold labeled with LC3B. White arrows indicate LC3B immune-gold label in autophagosomal structures. (F) Disrupted cells were incubated with agarose beads and LC3B antibody to pull down autophagosomes followed by western blotting for Atg5, LC3B, and Tom20 in purified autophagosomes. (G) Confocal microscopy for treated cells dual labeled with LC3B antibody and Tom20 mitochondrial marker. (H) Western blotting measuring ACO2, Tom20, and PDI in crenolanib-treated cells. (I) Electron microscopy visualization of autophagosomes in crenolanib-treated cells gold labeled with Tom20 or COX-17. Squares or small black arrows indicate gold label. White arrow indicates autophagosomes. (J) Western blot analysis for LC3B in sh-scr and sh-LC3B stable-transfected cells. (K) Percentage of viability measured using the MTT assay in sh-LC3B cells treated with different doses of crenolanib for 24 hours. (L) Percentage of nonviable cells measured using MTT assay in sh-scr, sh-LC3B, sh-LC3B+WTLC3B, and sh-LC3B+LC3BG120A. (M-N) Western blot to measure ACO2 and LC3B-II in crenolanib-treated sh-scr vs sh-CerS1 cells. *P value of <.05 using the 2-sided Student t test. All images are representative of at least 2 independent experiments.
Figure 3
Figure 3
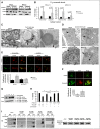
C18-ceramide accumulates in mitochondria and binds to LC3B to recruit autophagosomes to mitochondria. (A) MV4-11 or Molm-14 cells are fractionated to purify mitochondrial and cytosolic fractions followed by western blot to detect CerS1 in the purified fractions. Tom20 was used as a marker for mitochondrial fraction (M) and actin was used as a marker for cytosolic fraction (C); (B) HPLC-MS-MS measurement of C18-ceramide in mitochondrial and cytosolic fractions. (C) Electron microscopy (EM) visualization of MV4-11 cells treated with crenolanib and gold labeled with CerS1 antibody. Black arrows indicate gold label in mitochondria and white arrows indicate autophagosome. (D) EM visualization of MV4-11 or Molm-14 cells treated with crenolanib and gold labeled with ceramide antibody. Black arrows indicate gold label in mitochondria and white arrows indicate autophagosomes. (E) Treated sh-scr and sh-CerS1 cells are dual labeled with ceramide antibody and Tom20 mitochondrial marker and visualized using confocal microscopy. White arrows indicate colocalization. The quantification of ceramide-Tom20 colocalization from confocal microscopy was performed using the ImageJ Fiji software (right panel). (F) Crenolanib-treated MV4-11 cells are dual labeled with ceramide antibody and LC3B autophagosomal marker and visualized using confocal microscopy. White arrows indicate colocalization. (G) Western blot to detect LC3B protein in sh-LC3B cells reconstituted with LC3B WT or LC3B mutants (I35A and F52A) that cannot bind ceramide. (H) Percentage of viability measured using MTT assay for sh-scr, sh-LC3B, sh-LC3B+LC3B WT, sh-LC3B+LC3B I35A, and sh-LC3B+LC3BF52A, treated with crenolanib for 24 hours. (I) Autophagosomes were purified from vehicle or crenolanib treated in sh-LC3B cells reconstituted with LC3B WT or LC3B mutants (I35A and F52A) that cannot bind ceramide. This was followed by a western blot to detect autophagosome markers (Atg5 or LC3B) and Tom20 mitochondria marker. Values indicate mean ± SD of n = 3 independent experiments. *P value of <.05 using the 2-sided Student t test. C, cytosolic fraction; M, mitochondrial fraction; W, whole cell.
Figure 4
Figure 4
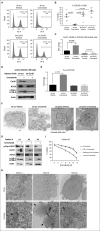
FLT3 inhibition–induced ceramide-mediated lethal mitophagy requires Drp1 S637 dephosphorylation and activation. (A) Western blot measuring p-Drp1 S616 and p-Drp1 S637 in cells treated with FLT3 inhibitor for 6 hours. (B) Western blot detecting Drp1 in mitochondrial and cytosolic fraction after 6 hours of crenolanib treatment. Tom20 was used as a marker for mitochondria and glyceraldehyde-3-phosphate dehydrogenase (GAPDH) was used as a marker for cytosolic fraction. (C) EM visualization of crenolanib-treated cells gold labeled with Drp1. (D) ACO2 and LC3B in crenolanib-treated sh-scr vs sh-Drp1 cells. (E) Western blot to measure CerS1 in mitochondrial and cytosolic fractions obtained from crenolanib-treated sh-scr and sh-Drp1 cells. (F) C18-ceramide measured by MS HPLC-MS-MS in mitochondrial and cytosolic fraction purified from crenolanib-treated sh-scr and sh-Drp1 cells. (G) Percentage of viability measured using the MTT assay in sh-scr, sh-Drp1, sh-Drp1+Drp1WT, sh-Drp1+Drp1S637A, and sh-Drp1+Drp1S637D cells in response to 24-hour treatment with 5 μM crenolanib. (H) Western blot to detect LC3B in sh-Drp1 cells reconstituted with Drp1S637A (A) or Drp1S637D (D) mutants. (I) Western blot to detect CerS1 in purified mitochondrial fractions from sh-Drp1 cells reconstituted with Drp1 S637A (A) or Drp1 S637D (D) mutants. Tom20 and actin levels were used as positive and negative controls, respectively. Values indicate mean ± SD of n = 3 independent experiments. *P value of <.05 using the 2-sided Student t test.
Figure 5
Figure 5
LCL-461 accumulates in mitochondria to induce LC3B-dependent lethal mitophagy regardless of FLT3 mutation status. (A) Chemical structure of LCL-461 or C18-pyridinium ceramide. (B) MS detection of LCL-461 in mitochondrial, cytosolic, and nuclear fractions in vehicle and LCL-461–treated MV4-11 or normal human bone marrow cells. (C) Percentage of viability measured using MTT assay in MV4-11, MV4-11–resistant, sh-LC3B, and sh-Drp1 cells in response to LCL-461. (D) Percentage of viability measured using the MTT assay of AML cell lines with different FLT3 mutations in response to LCL-461. (E) Western blot showing LC3B in LCL-461–treated cells transfected with scr or Drp1 siRNA. (F) EM visualization of mitophagosomes induced by LCL-461 treatment in MV4-11 cells treated with 5 μM LCL-461. White arrows indicate autophagosomes and black arrows indicate mitochondria. Values indicate mean ± SD of n = 3. *P value of <.05 using the 2-sided Student t test.
Figure 6
Figure 6
CerS1-C18-ceramide–mediated lethal mitophagy is required for FLT3-_targeted therapy in the AML mouse model and human AML blasts. (A-B) FACS analysis to measure the percentage of injected AML cells (hCD45+ cells) in the bone marrow. Values indicate mean ± SD of n = 6 mice. P values were generated using ANOVA. (C) qPCR to measure CerS1 mRNA in sorted hCD45+ cells. (D) Western blot to measure CerS1, ACO2, and LC3B in sorted hCD45+ cells. (E) HPLC-MS-MS measuring C18-ceramide in sorted hCD45+ cells. Values indicate mean ± SD of n = 3 mice. P values were generated using the Student t test. (F) EM visualization of sorted hCD45+ cells from bone marrow of NSG mice with AML xenografts. (G) CD34+ bone marrow blasts obtained from FLT3-ITD+ patients were treated with 5 μM crenolanib for 24 hours, followed by western blot to detect p-Drp1 S637, CerS1, ACO2, and LC3B. (H) EM visualization of crenolanib-treated FLT3+ AML patient blasts labeled with ceramide antibody. White arrows indicate ceramide gold label in mitochondria and black arrows indicate autophagosomes. (I) Percentage of viability of AML patient blasts pretreated with either FB-1, bafilomycin, or mdivi1, followed by 5 μM crenolanib treatment of 24 hours. *P value of <.05 using the 2-sided Student t test.
Figure 7
Figure 7
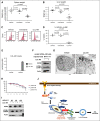
LCL-461 has anti-AML effect in AML mouse model and in human AML blasts. (A) Measured weights of harvested spleen at day 30 after injection of cells. (B) Measured weights of harvested liver. (C-D) FACS analysis to measure the percentage of injected MV4-11-R cells (hCD45+ cells) in the bone marrow. Values indicate mean ± SD of n = 6 mice. P values are generated using ANOVA. (E) MS measuring LCL-461 in sorted hCD45+ cells vs hCD45 cells. (F) Western blot to measure ACO2 and LC3B in sorted hCD45+ cells. (G) Electron microscopy visualization of the morphology of sorted hCD45+ cells obtained from bone marrow of mice injected with vehicle or LCL-461. Values indicate mean ± SD of n = 3 mice. P values are generated using the 2-sided Student t test. (H) AML bone marrow blasts obtained from FLT3+ patients were treated with different doses of LCL-461 to measure percentage of viability at 24 hours. (I) AML bone marrow blasts obtained from FLT3+ patients were treated with 8 μM LCL-461 followed by western blot to measure ACO2 matrix protein degradation and LC3B lipidation. (J) Scheme illustrating the mechanism by which _targeting mitochondria using LCL-461 results in lethal mitophagy in FLT3+ AML.

Comment in

  • Fighting fat in AML.
    Li S. Li S. Blood. 2016 Oct 13;128(15):1910-1911. doi: 10.1182/blood-2016-08-735704. Blood. 2016. PMID: 27737846 No abstract available.

Similar articles

Cited by

References

    1. Kadia TM, Ravandi F, Cortes J, Kantarjian H. Toward individualized therapy in acute myeloid leukemia: a contemporary review. JAMA Oncol. 2015;1(6):820–828. - PubMed
    1. Stone RM, DeAngelo DJ, Klimek V, et al. Patients with acute myeloid leukemia and an activating mutation in FLT3 respond to a small-molecule FLT3 tyrosine kinase inhibitor, PKC412. Blood. 2005;105(1):54–60. - PubMed
    1. Kiyoi H, Ohno R, Ueda R, Saito H, Naoe T. Mechanism of constitutive activation of FLT3 with internal tandem duplication in the juxtamembrane domain. Oncogene. 2002;21(16):2555–2563. - PubMed
    1. Mizuki M, Fenski R, Halfter H, et al. Flt3 mutations from patients with acute myeloid leukemia induce transformation of 32D cells mediated by the Ras and STAT5 pathways. Blood. 2000;96(12):3907–3914. - PubMed
    1. Choudhary C, Schwäble J, Brandts C, et al. AML-associated Flt3 kinase domain mutations show signal transduction differences compared with Flt3 ITD mutations. Blood. 2005;106(1):265–273. - PubMed

MeSH terms

  NODES
INTERN 2
twitter 2