. 2016 Oct 14;291(42):22276-22287.
doi: 10.1074/jbc.M116.738849. Epub 2016 Aug 30.

Early Growth Response 1 (Egr-1) Is a Transcriptional Activator of β-Secretase 1 (BACE-1) in the Brain

Affiliations

Early Growth Response 1 (Egr-1) Is a Transcriptional Activator of β-Secretase 1 (BACE-1) in the Brain

Xike Qin et al. J Biol Chem. .

Abstract

Accumulation of amyloid-β peptide (Aβ) in the brain is regarded as central to Alzheimer's disease (AD) pathogenesis. Aβ is generated by a sequential cleavage of amyloid precursor protein (APP) by β-secretase 1 (BACE-1) followed by γ-secretase. BACE-1 cleavage of APP is the committed step in Aβ synthesis. Understanding the mechanism by which BACE-1 is activated leading to Aβ synthesis in the brain can provide better understanding of AD pathology and help to develop novel therapies. In this study, we found that the levels of Aβ and BACE-1 are significantly reduced in the brains of mice lacking transcription factor early growth response 1 (Egr-1) when compared with the WT. We demonstrate that in COS-7 cells, Egr-1 binds to the BACE-1 promoter and activates BACE-1 transcription. In rat hippocampal primary neurons, overexpression of Egr-1 induces BACE-1 expression, activates BACE-1, promotes amyloidogenic APP processing, and enhances Aβ synthesis. In mouse hippocampal primary neurons, knockdown of BACE-1 almost completely blocks Egr-1-induced amyloidogenic APP processing and Aβ synthesis. Our data indicate that Egr-1 promotes Aβ synthesis via transcriptional activation of BACE-1 and suggest that Egr-1 plays role in activation of BACE-1 and acceleration of Aβ synthesis in AD brain. Egr-1 is a potential therapeutic _target for AD.

Keywords: amyloid-β (Aβ); early growth response protein 1 (EGR1); gene regulation; neuroscience; promoter; transcription factor.


Figures

FIGURE 1.
FIGURE 1.
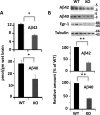
Levels of Aβ40 and Aβ42 are reduced in Egr-1 KO mice. Levels of Aβ40 and Aβ42 in the brain extracts of Egr-1 KO and WT mice were analyzed by sandwich ELISA and Western blotting. A, sandwich ELISA. B, Western blots. Western blotting was performed using a 4–20% Tricine gel. Data are mean ± S.E. from six age-matched animals in each group. Compared with the WT, significantly lower levels of Aβ40 and Aβ42 were observed in KO mice brain by sandwich ELISA (*, p < 0.05) and Western blotting analysis (**, p < 0.01) (t test).
FIGURE 2.
FIGURE 2.
BACE-1 level is reduced in Egr-1 KO mice. A, levels of PS1, PS2, neprilysin, and IDE in the brains of Egr-1 KO and WT mice. Upper panel shows representative Western blots. Lower panel is quantification. No significant difference was found among the groups (mean ± S.E., n = 6/group). B, BACE-1 level is reduced in Egr-1 KO mouse brain. BACE-1 protein and mRNA and activity levels in Egr-1 KO and WT mice were determined and compared by Western blotting, qPCR, and fluorogenic BACE-1 activity assay. Data are mean ± S.E. from five different animals in each group. Upper panel is a representative Western blot. Lower panels are quantifications of BACE-1 protein from Western blottings, qPCR analysis for mRNA, and BACE-1 activity assay. Compared with the WT, significantly reduced BACE-1 protein (*, p < 0.05), mRNA (*, p < 0.04), and activity (*, p < 0.05) is observed in Egr-1 KO mouse brain (t test). C, BACE-1 immunostaining is reduced in Egr-1 KO mouse brain. Brain sections of Egr-1 KO and WT mice were immunostained against BACE-1. Upper panel is a representative BACE-1 immunostained micrographs of brain sections. Boxed areas of panel a (WT) and panel b (KO) are shown in panels c–j in higher magnifications. WT: panel c, cortex; panels e, g, and i, hippocampus. KO: panel d, cortex; panels f, h, and j, hippocampus. BACE-1 is widely expressed all over the brain. Significant staining is seen in the CA1, CA2, and dentate gyrus subfields of hippocampus. Egr-1 KO mice also display similar distribution patterns but significantly reduced levels. Lower panel is quantification of BACE-1 immunoreactivity from micrographs of five mice in each group using Spectrum Analysis algorithm package and ImageScope analysis software (version 11.2, Aperio Technologies). Compared with the WT, Egr-1 KO mice have a significantly lower level of BACE-1 in the cortex (*, < 0.05) and the hippocampus (*, < 0.05) (t test). Scale bars,500 μm (panels a and b), 200 μm (panels c and d), 50 μm (panels i and j), 20 μm (panels g and h), and 10 μm (panels e and f).
FIGURE 3.
FIGURE 3.
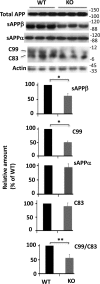
Levels of sAPPβ and C99 are reduced in Egr-1 KO mice. Western blotting was performed using antibodies against sAPPβ, sAPPα, and APP-CTF. C99 and C83 were separated on a 4–12% gradient BisTris gel. Data are mean ± S.E., n = 6 each group; *, p < 0.05 (sAPPβ); *, p < 0.04 (C99); **, p < 0.01(C99/C83) (t test).
FIGURE 4.
FIGURE 4.
Egr-1 binds to BACE-1 promoter and activates BACE-1 transcription. Luciferase assay was performed to evaluate the binding of Egr-1 onto the BACE-1 promoter. A, schematic diagram of the constructs used to identify the Egr-1-binding site on BACE-1 promoter by luciferase assay. Putative Egr-1-binding site and mutations used to disrupt the binding sequence are shown. These constructs in pGL3 plasmid were co-transfected with Egr-1 and Renilla luciferase reporter plasmid in COS-7 cells. After 24 h, cells were harvested and subjected to luciferase activity assay as described under “Materials and Methods.” Values are expressed as the fold of Luc-0 control. B, bar graphs represent data average ±S.E. from four independent experiments. ***, p < 0.001 against Luc-0- and Egr-1-transfected cells (one-way ANOVA).
FIGURE 5.
FIGURE 5.
Egr-1 is recruited to BACE-1 promoter in response to PMA exposure in COS-7 cells. COS-7 cells were treated with PMA to induce Egr-1 expression for various time points and then analyzed either for expressions of Egr-1 and BACE-1 by semiquantitative PCR or subjected to ChIP assay using anti-Egr-1 antibody or IgG control. For semiquantitative PCR, RNA purified from cells treated with PMA or vehicle was purified and subjected to RT-PCR for cDNA synthesis. Each synthesized cDNA was amplified using primers against Egr-1, BACE-1, or GAPDH control by PCR. Products were analyzed on agarose gels and quantified by normalizing against GAPDH. A, semiquantitative PCR analysis of cells treated with PMA for 1 h. Upper panel is a representative agarose gel. Lower panel is quantification. Values are the average ± S.E. of four independent determinations. **, p < 0.01 (t test). B, ChIP assay. Cells treated with PMA for 1 h were immunoprecipitated using either anti-Egr-1 antibody or IgG control. BACE-1 promoter in the immunoprecipitate was amplified by qPCR using primers specific to Egr-1-binding site of BACE-1 promoter identified by luciferase assay (Table 1). GAPDH was amplified as the internal control. Bar graphs were generated from qPCR data from four independent cultures. ***, p < 0.0005 (t test). Lower panel compares BACE-1 promoter amplification between vehicle and PMA-treated cells. To make the comparison, qPCR value obtained for the IgG from the ChIP data of a sample was subtracted from the corresponding value for the anti-Egr-1. Resulting values were used to generate the graph. Values are the average of three determinations. ***, p < 0.001 (one-way ANOVA). C, time course of Egr-1 recruitment to BACE-1 promoter and BACE-1 expression during PMA exposure. Cells treated with PMA for each indicated time point were either analyzed by semiquantitative PCR or subjected to ChIP assay for Egr-1 binding to the BACE-1 promoter as in B. Upper panel is a representative agarose DNA gel showing expressions of BACE-1 and Egr-1. Lower panel is a graph showing recruitment of Egr-1 onto the BACE-1 promoter (by ChIP assay) and BACE-1 expression (by semiquantitative PCR). Data are average of three determinations and are expressed as the fold of zero time point.
FIGURE 6.
FIGURE 6.
Overexpression of Egr-1 activates BACE-1 in the rat hippocampal primary neurons. Rat hippocampal primary neurons in culture for 14 days were infected with Ln-Egr-1 or Ln vector. Cell were analyzed for level of BACE-1 by Western blotting, qPCR, immunocytochemistry, and fluorogenic BACE-1 activity assay. Western blotting was performed for C99 and C83 as in Fig. 3 using anti-APP-CTF antibody. Culture medium was analyzed for sAPPβ, sAPPα (Western blotting), and Aβ42 (ELISA). A, representative Western blots and bar graphs of quantification of BACE-1 protein (Western blots), mRNA (qPCR), and activity (fluorogenic BACE-1 activity assay), C99 and C83 from lysates and levels of sAPPβ (Western blots) and Aβ42 (mouse Aβ42 ELISA kit) in the medium from four different cultures. To determine C99/C83 ratio, C99 value of a sample was divided by C83 value of that sample. Data are mean ± S.E. BACE-1 protein (*, p < 0.05), BACE-1-mRNA (*, p < 0.04), BACE-1 activity (**, p < 0.005), C99 (**, p < 0.01), C99/C83 (**, p < 0.001), sAPPβ (*, p < 0.05), and Aβ42 (**, p < 0.01), C83 (*, p < 0.05), and sAPPα (*p < 0.05) (t test). B, confocal micrograph of immunocytochemistry of infected (GFP-positive) neurons showing BACE-1 (red) and Egr-1 (green). Quantification of BACE-1 level is from micrographs of 15 randomly chosen infected neurons from four different cultures in each group along at least 30 μm of each neurite. Compared with Ln vector-infected neurons, Ln-Egr-1-infected neurons show significantly increased BACE-1 immunoreactivity (**, p < 0.01) (t test).
FIGURE 7.
FIGURE 7.
Egr-1 activates BACE-1 and promotes amyloidogenic APP processing in COS-7 cells. A, Egr-1 activates BACE-1. COS-7 cells transfected with Egr-1 or vector were analyzed for BACE-1 protein (Western blotting), mRNA (qPCR), and activity (fluorogenic BACE-1 activity assay). Upper panel is a representative Western blot. Data are mean ± S.E. from four different cultures. Compared with vector-transfected cells, Egr-1-transfected cells show significantly enhanced levels of BACE-1 protein (**, p < 0.01), BACE-mRNA (**, p < 0.005), and BACE-1 activity (***, p < 0.001) (t test). B, Egr-1 accelerates amyloidogenic APP processing. APPSwe was co-transfected in COS-7 cells with either vector or Egr-1. Transfected cell lysates were analyzed for levels of C83 and C99 by Western blotting. Culture media were used to analyze sAPPβ by Western blotting and Aβ42 by human Aβ42 ELISA kit. Data are mean ± S.E. from four different cultures. Compared with cells expressing APPSwe, those expressing APP and Egr-1 had significantly increased levels of sAPPβ (**, p < 0.005), C99 (**, p < 0.001), and Aβ42 (**, p < 0.001) (t test).
FIGURE 8.
FIGURE 8.
Knockdown of BACE-1 blocks Egr-1-induced amyloidogenic APP processing in mouse hippocampal primary neurons. Neurons co-infected with shRNA-BACE-1, shRNA-ctl, Ln-Egr-1, and Ln-vector in various combinations were lysed and analyzed as in Fig. 6. A, representative Western blots and quantification of BACE-1 protein and activity. Values are the average of four independent cultures. *, p < 0.05; **, p < 0.005, one-way ANOVA. B, quantification of C99, C83, and C99/C83. Quantifications were performed from Western blots from A. Values are the average of four independent cultures. *, p < 0.05; **, p < 0.005, one-way ANOVA. C, quantification of sAPPβ and Aβ42. Culture medium was analyzed by Western blotting for sAPPβ and sandwich ELISA for Aβ42. Values are from four different cultures. *, p < 0.04; **, p < 0.001, one-way ANOVA.

Similar articles

Cited by

References

    1. Vassar R., Kovacs D. M., Yan R., and Wong P. C. (2009) The β-secretase enzyme BACE in health and Alzheimer's disease: regulation, cell biology, function, and therapeutic potential. J. Neurosci. 29, 12787–12794 - PMC - PubMed
    1. Yang L. B., Lindholm K., Yan R., Citron M., Xia W., Yang X. L., Beach T., Sue L., Wong P., Price D., Li R., and Shen Y. (2003) Elevated β-secretase expression and enzymatic activity detected in sporadic Alzheimer disease. Nat. Med. 9, 3–4 - PubMed
    1. Fukumoto H., Cheung B. S., Hyman B. T., and Irizarry M. C. (2002) β-Secretase protein and activity are increased in the neocortex in Alzheimer disease. Arch. Neurol. 59, 1381–1389 - PubMed
    1. Holsinger R. M., McLean C. A., Beyreuther K., Masters C. L., and Evin G. (2002) Increased expression of the amyloid precursor β-secretase in Alzheimer's disease. Ann. Neurol. 51, 783–786 - PubMed
    1. Tyler S. J., Dawbarn D., Wilcock G. K., and Allen S. J. (2002) α- and β-secretase: profound changes in Alzheimer's disease. Biochem. Biophys. Res. Commun. 299, 373–376 - PubMed

MeSH terms

LinkOut - more resources

  NODES
INTERN 1
twitter 2