. 2016 Aug 31;537(7621):544-547.
doi: 10.1038/nature19353.

Fumarate is an epigenetic modifier that elicits epithelial-to-mesenchymal transition

Affiliations

Fumarate is an epigenetic modifier that elicits epithelial-to-mesenchymal transition

Marco Sciacovelli et al. Nature. .

Erratum in

  • Corrigendum: Fumarate is an epigenetic modifier that elicits epithelial-to-mesenchymal transition.
    Sciacovelli M, Gonçalves E, Johnson TI, Zecchini VR, da Costa AS, Gaude E, Drubbel AV, Theobald SJ, Abbo SR, Tran MG, Rajeeve V, Cardaci S, Foster S, Yun H, Cutillas P, Warren A, Gnanapragasam V, Gottlieb E, Franze K, Huntly B, Maher ER, Maxwell PH, Saez-Rodriguez J, Frezza C. Sciacovelli M, et al. Nature. 2016 Dec 1;540(7631):150. doi: 10.1038/nature20144. Epub 2016 Oct 19. Nature. 2016. PMID: 27760119 No abstract available.

Abstract

Mutations of the tricarboxylic acid cycle enzyme fumarate hydratase cause hereditary leiomyomatosis and renal cell cancer. Fumarate hydratase-deficient renal cancers are highly aggressive and metastasize even when small, leading to a very poor clinical outcome. Fumarate, a small molecule metabolite that accumulates in fumarate hydratase-deficient cells, plays a key role in cell transformation, making it a bona fide oncometabolite. Fumarate has been shown to inhibit α-ketoglutarate-dependent dioxygenases that are involved in DNA and histone demethylation. However, the link between fumarate accumulation, epigenetic changes, and tumorigenesis is unclear. Here we show that loss of fumarate hydratase and the subsequent accumulation of fumarate in mouse and human cells elicits an epithelial-to-mesenchymal-transition (EMT), a phenotypic switch associated with cancer initiation, invasion, and metastasis. We demonstrate that fumarate inhibits Tet-mediated demethylation of a regulatory region of the antimetastatic miRNA cluster mir-200ba429, leading to the expression of EMT-related transcription factors and enhanced migratory properties. These epigenetic and phenotypic changes are recapitulated by the incubation of fumarate hydratase-proficient cells with cell-permeable fumarate. Loss of fumarate hydratase is associated with suppression of miR-200 and the EMT signature in renal cancer and is associated with poor clinical outcome. These results imply that loss of fumarate hydratase and fumarate accumulation contribute to the aggressive features of fumarate hydratase-deficient tumours.


Conflict of interest statement

The authors declare no competing financial interests.

Figures
Extended Data Figure 1
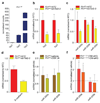
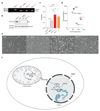
Extended Data Figure 1. Characterisation of Fh1-deficient and Fh1-rescued cells.
a, PCR to assess Fh1 recombination. The putative genotypes are indicated on the right and are based on the expected size of the genomic PCR amplification products as from Frezza et al. Fh1fl/fl = 470 bp and Fh1-/-= 380 bp. b, Fh1 protein levels measured by western blot of cells of the indicated genotype. Calnexin was used as loading control for western blot. c, Intracellular fumarate levels measured by LCMS and normalised to total ion count. Results were obtained from 4 independent cultures and are indicated as average ± S.D.. p-values were calculated from one-way ANOVA. d, Oxygen Consumption rate (OCR) and Extracellular Acidification rate (ECAR) assessed using the Seahorse Extracellular Flux Analyser. Results were obtained from 5 replicate wells and are presented as average ± S.D.. e, Bright field images of cells of the indicated phenotype. Bar = 400 µm. Western blot and gel sources are presented in Supplementary Figure 1. Raw data are presented in SI Table 2. *P ≤0.05, **P ≤0.01, ***P ≤0.001, ****P≤0.0001. f, Schematic representation of the proposed link between loss of FH, fumarate accumulation, and epigenetic suppression of the antimetastatic cluster of miRNA miR-200. Upon accumulation of fumarate as a result of FH inactivation, the TET-mediated demethylation of the miR-200ba429 cluster is inhibited, leading to their epigenetic suppression. As a consequence, Zeb1/2 are de-repressed, eliciting a signalling cascade that leads to EMT.
Extended Data Figure 2
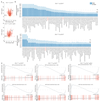
Extended Data Figure 2. EMT signature in Fh1-/- cells.
a, Volcano plot of RNA-seq analysis. Gene expression was normalised to Fh1fl/fl or Fh1-/-+pFh1 cells as indicated. b, c, Gene set enrichment analysis (b) and EMT enrichment score (c) of the indicated cell lines.
Extended Data Figure 3
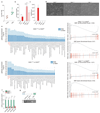
Extended Data Figure 3. EMT signature in UOK262 cells.
a, Gene set enrichment analysis and EMT enrichment score of the indicated cell lines. Gene expression was normalised to UOK262pFH. b, c, mRNA expression measured by qPCR (b) and protein levels measured by western blot (c) of the indicated EMT markers. d, Immunofluorescence staining for Vimentin and E-Cadherin. DAPI was used as marker for cell nuclei. Scale Bar = 25 µm. e, Cell migration rate. Results were obtained from 14 replicate wells and presented as mean ± S.D.. f, mRNA expression of EMT-related transcription factors ZEB1 and ZEB2 from RNA-seq data as in Fig. 1a. g, Expression levels of the indicated miRNAs measured by qPCR. h, Volcano plot of miRNA profiling. All qPCR experiments were obtained from 3 independent experiments and presented as RQ with max values, normalised to β-actin or RNU6B/SNORD61 as endogenous control for mRNA and miRNA analyses, respectively. *P ≤0.05, **P ≤0.01, ***P ≤0.001, ****P≤0.0001. Western blot sources are presented in Supplementary Figure 1. Raw data are presented in SI Table 2.
Extended Data Figure 4
Extended Data Figure 4. EMT features in Fh1-deficient cells are independent from HIF.
mRNA levels of EMT genes (a) and HIF _target genes (b) in Fh1-/- cells infected with shRNA against HIF1β measured by qPCR. Results were obtained from 3 independent cultures and presented as RQ with max values using β-actin as endogenous control. NTC = non-_targeting control. p-values from unpaired t-test are indicated in the graph. LdhA = lactate dehydrogenase A; Pdk1 = pyruvate dehydrogenase kinase 1; Glut 1 = glucose transporter 1. *P ≤0.05, **P ≤0.01, ***P ≤0.001, ****P≤0.0001. Raw data are presented in SI Table 2.
Extended Data Figure 5
Extended Data Figure 5. EMT signature in Fh1-reconstituted cells.
a, Fh1 protein levels measured by western blot. Calnexin was used as loading control. b, Intracellular fumarate levels the measured by LCMS. Data are presented as average ± S.D.. c, Representative bright field images of cells of the indicated genotype. Scale Bar = 400 µm. d, e, mRNA expression measured by qPCR (d) and protein levels measured by western blot (e) of the indicated EMT markers. f, Average speed of cells calculated after tracking cells for 3 hours as in Fig. 1g. Results were generated from 3 independent cultures. g, mRNA expression of EMT-related transcription factors. β-actin was used as endogenous control. EV = empty vector. h, Expression levels of the indicated miRNAs measured by qPCR and normalised to Snord95 and Snord61 as endogenous control. All qPCR results were obtained from 3 independent cultures and presented as RQ with max values. *P ≤0.05, **P ≤0.01, ***P ≤0.001, ****P≤0.0001. Western blot sources are presented in Supplementary Figure 1. Raw data are presented in SI Table 2.
Extended Data Fig. 6
Extended Data Fig. 6. Role of Tets and Histone Demethylases in EMT induction.
a, Expression levels of Tet1-3 in Fh1 fl/fl from RNA-seq data. b, d, Expression levels of Tet2/3 (b), miRNA200 (c), and E-cadherin (d) in Fh1 fl/fl cells upon combined silencing of Tet2 and Tet3. The results are presented as RQ with max values obtained from technical replicates. β-actin and Snord61 were used as endogenous control for mRNA and miRNA, respectively. e, Expression levels of the indicated miRNAs upon inhibition of histone demethylases by GSK J4. Snord61 and Snord95 were used as endogenous controls. f, Expression of the indicated miRNAs in Fh1-/- cells incubated for 24 hours with 5 mM DM-aKG measured by qPCR. Results were obtained from 4 (vehicle) or 5 (Fh1-/-CL19) and 3 (Fh1-/-CL1) (DM-aKG) independent cultures and presented as RQ with max values, normalised to Snord95 as endogenous control. *P ≤0.05, **P ≤0.01, ***P ≤0.001, ****P≤0.0001.
Extended Data Fig. 7
Extended Data Fig. 7. Characterisation of the regulatory CpG island CpG43.
a, Snapshot of Genome Browser view of genomic DNA around the miR200ba429 cluster taken from NCBI37/mm9. Tet2 ChIP was obtained from GSE41720, sample GSM1023124. Shaded rectangles indicate miR-200ba429 and CpG43. b, ChIP-PCR of the indicated histone marks in a region adjacent CpG43. Data were obtained from 3 independent cultures and are presented as average ± S.D.. p-values from unpaired t-tests are indicated in the graph. c, Expression levels of H3 histone marks in cells of the indicated genotypes measured by western blot. H3 used as loading control. d, 3C data of the genomic region adjacent to CpG43 analysed in Fh1fl/fl cells. The position of CpG30 and CpG43, and of the predicted restriction sites are indicated in the graph. Results were generated from 2 independent cultures. e, DNA methylation of the CpG43 assessed by qPCR using OneStep qMethyl kit. Data were obtained from 3 independent experiments and normalised to methylation levels of the region in Fh1fl/fl. Data are presented as average ± S.E.M.. f, ChIP-PCR of Tets binding to CpG43. Data were obtained from three replicates and are presented as average ± S.D.. g, 5hmc nuclear staining assessed by immunofluorescence using 5hmc antibody. Nuclear staining was quantified using Image J and an average of 120 cells was used per genotype. p-values from One-way ANOVA test. Representative images of 5hmc staining are shown. DAPI is used to indicate the nuclei. Bar = 20 μm. *P ≤0.05, **P ≤0.01, ***P ≤0.001, ****P≤0.0001. Western blot sources are presented in Supplementary Figure 1. Raw data are presented in SI Table 2.
Extended Data Fig. 8
Extended Data Fig. 8. Monomethyl Fumarate (MMF) triggers EMT in FH-proficient cells.
a, Bright field images of cells treated for 6 weeks with MMF. Arrows indicate the typical protrusion of cells of mesenchymal phenotype. Bar = 400 µm. b, Oxygen consumption rate of the indicated cell lines treated chronically with MMF (as in Fig. 3). See Methods for drugs concentrations. OCR was normalised to total protein content. Results were obtained from 6 (for mouse cells) or 8 (for human cells) wells ± SD.. c, Hive plot of metabolomics data of mouse and human cells treated with MMF (as in Fig. 3). All identified metabolites are included on the y-axis and grouped into human (pink) and mouse (green) cells. Metabolites accumulated (right x-axis) or depleted (left x-axis) in MMF-treated cells versus control are indicated by a connecting arc and their fold-change is colour-coded. Metabolites accumulated commonly across the two cell lines are highlighted with a solid line. 2SC: 2-succinic-cysteine, succGSH: succinic-GSH. Raw data are presented in SI Table 2. Raw metabolomic data are presented in SI Table 3.
Extended Data Fig. 9
Extended Data Fig. 9. Succinate triggers EMT in Sdhb-deficient cells.
a, Intracellular succinate levels after incubation with 4 mM MMS measured by LCMS. Data are presented as average ±S.D.. b, c, Intracellular succinate (b) and succGSH (c) levels in Sdhb-deficient cells measured by LMCS. Data are presented as average ±S.D.. d, Bright field images of cells of the indicated genotype. Bar = 400 µm. e, Gene set enrichment analysis and EMT enrichment score from expression analysis of the indicated cell lines. f, g, miRNA expression levels normalised to Snord61 and Snord95 as endogenous control (f) and CpG43 methylation (g). Experiments were performed as in Fig. 2b and 2d, respectively. *P ≤0.05, **P ≤0.01, ***P ≤0.001, ****P≤0.0001. Gel sources are presented in Supplementary Figure 1. Raw data are presented in SI Table 2.
Extended Data Fig. 10
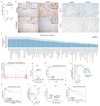
Extended Data Fig. 10. Expression of FH and EMT markers in kidney cancer.
a, Expression levels of Vimentin and E-Cadherin in HLRCC patients obtained from Ooi et al. b, Immunohistochemistry staining of Vimentin and E-Cadherin (left), and TET1 and TET2 (right) in HLRCC patients obtained as in Fig. 4a. Bar = 100 µm. The insert in the left panel indicate a 3X digital magnification, Bar = 50 µm. c, Gene set enrichment analysis and EMT enrichment score from RNA-seq data of papillary renal cell carcinoma (KIRP) obtained by Linehan et al. d, Volcano plot of MIRNA expression in KIRP. e, Kaplan-Meier curve of KIRP patients separated according to FH expression. f, Vimentin and E-Cadherin expression in FH-mutant KIRP compared to normal renal tissue. g, Frequency of mutations in FH and TET1, TET2 and TET3 in KIRP analysed using NCBO BioPortal. Only cancers with mutations in the indicated genes are shown. h, Kaplan-Meier curve of FH-wild type and FH-mutant KIRP. i, Expression levels of FH, Vimentin, and E-Cadherin in clear cell renal cell carcinoma (KIRC) obtained from TCGA dataset. j, Volcano plot of miRNA expression in KIRC. j, Kaplan-Meier curve of KIRC patients separated according to FH expression.
Figure 1
Figure 1. FH-deficient cells display mesenchymal features.
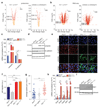
a, b, Volcano plots of proteomics (a) and RNA-seq (b) experiments. FDR = false discovery rate. c, d, mRNA expression measured by qPCR (c) and protein levels measured by western blot (d) of EMT markers. e, Immunofluorescence staining for vimentin and E-cadherin. Scale Bar = 25 µm. f, Cells migration assay. Data indicate cell index at 17 hours. Results were obtained from 4 (Fh1 -/-+pFh1) or 3 replicate wells and presented as mean ± S.D. p-value was calculated using One way-ANOVA. g, Average speed of cells. p-value was calculated using Mann-Whitney test. Results were obtained from 3 independent cultures. h, mRNA expression of EMT-related transcription factors measured by qPCR. i, Western blot analysis of Zeb1. Calnexin was used as loading control. All qPCR results were obtained from 3 independent cultures and presented as RQ with max values, normalised for β-actin. p-values was calculated using unpaired t-test. *P ≤0.05, **P ≤0.01, ***P ≤0.001, ****P≤0.0001. For western blot source data, see Supplementary Figure 1. For Raw data see SI Table 2.
Figure 2
Figure 2. Loss of Fh1 triggers epigenetic suppression of miR-200.
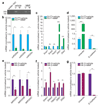
a, Volcano plot of miRNA profiling. b, miRNAs expression measured by qPCR. Date were normalised to Snord95. c, miRNAs and EMT markers expression in Fh1-/- cells expressing miR-200ba429. β-actin and Snord95 were used as endogenous control for mRNA and miRNA, respectively. NTC= non-_targeting control. d, Methylation-specific PCR of CpG43. U = un-methylated; M = methylated CpG island. The miR-200ba429 cluster (blue) and CpG43 (green) are represented in the schematic. qPCR results were obtained from at least 3 independent cultures and presented as RQ with max values. p-values was calculated using unpaired t-test. *P ≤0.05, **P ≤0.01, ***P ≤0.001, ****P≤0.0001. For gel source data, see Supplementary Figure 1. For Raw data see SI Table 2.
Figure 3
Figure 3. Fumarate triggers EMT in FH-proficient cells.
miRNA methylation (a) and expression (b, e); EMT transcription factors (c, f) and EMT markers (d, g) levels from MMF-treated cells. Results were obtained from 3 independent cultures. qPCRs are presented as RQ with max values, normalised for Snord95 (mouse) or SNORD95 (human) for miRNAs, and for β-actin for mRNA. p-values were calculated using unpaired t-test. *P ≤0.05, **P ≤0.01, ***P ≤0.001, ****P≤0.0001. For gel source data, see Supplementary Figure 1. For Raw data see SI Table 2.
Figure 4
Figure 4. Loss of FH correlates with EMT signature in renal cancers.
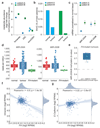
a-c, Metabolomic analysis (a), 5hmc levels in DNA (b), and MIRNAs expression (c) in tumour samples from two HLRCC patients. Results were obtained from 4 technical replicates per sample. qPCRs are presented as RQ with max values, normalised for RNU6B and SNORD61. d, e, Expression levels (d), and promoter methylation (e) of the indicated MIRNAs in KIRP patients f, g, Vimentin (f) and E-Cadherin (g) expression in clear cell renal cell carcinoma (KIRC) patients. For Raw data see SI Table 2.

Comment in

Similar articles

Cited by

References

    1. Tomlinson IP, Alam NA, Rowan AJ, Barclay E, Jaeger EE, Kelsell D, Leigh I, Gorman P, Lamlum H, Rahman S, et al. Germline mutations in FH predispose to dominantly inherited uterine fibroids, skin leiomyomata and papillary renal cell cancer. Nat Genet. 2002;30:406–410. - PubMed
    1. Schmidt LS, Linehan WM. Hereditary leiomyomatosis and renal cell carcinoma. Int J Nephrol Renovasc Dis. 2014;7:253–260. - PMC - PubMed
    1. Yang M, Soga T, Pollard PJ, Adam J. The emerging role of fumarate as an oncometabolite. Front Oncol. 2012;2:85. doi: 10.3389/fonc.2012.00085. - DOI - PMC - PubMed
    1. Laukka T, Mariani CJ, Ihantola T, Cao JZ, Hokkanen J, Kaelin WG, Jr, Godley LA, Koivunen P. Fumarate and Succinate Regulate Expression of Hypoxia-Inducible Genes via TET Enzymes. J Biol Chem. 2015 - PMC - PubMed
    1. Xiao M, Yang H, Xu W, Ma S, Lin H, Zhu H, Liu L, Liu Y, Yang C, Xu Y, et al. Inhibition of alpha-KG-dependent histone and DNA demethylases by fumarate and succinate that are accumulated in mutations of FH and SDH tumor suppressors. Genes Dev. 2012;26:1326–1338. - PMC - PubMed

Publication types

  NODES
Project 1
twitter 2