. 2016 Sep 22;537(7621):539-543.
doi: 10.1038/nature19364. Epub 2016 Sep 14.

Ionic immune suppression within the tumour microenvironment limits T cell effector function

Affiliations

Ionic immune suppression within the tumour microenvironment limits T cell effector function

Robert Eil et al. Nature. .

Abstract

Tumours progress despite being infiltrated by tumour-specific effector T cells. Tumours contain areas of cellular necrosis, which are associated with poor survival in a variety of cancers. Here, we show that necrosis releases intracellular potassium ions into the extracellular fluid of mouse and human tumours, causing profound suppression of T cell effector function. Elevation of the extracellular potassium concentration ([K+]e) impairs T cell receptor (TCR)-driven Akt-mTOR phosphorylation and effector programmes. Potassium-mediated suppression of Akt-mTOR signalling and T cell function is dependent upon the activity of the serine/threonine phosphatase PP2A. Although the suppressive effect mediated by elevated [K+]e is independent of changes in plasma membrane potential (Vm), it requires an increase in intracellular potassium ([K+]i). Accordingly, augmenting potassium efflux in tumour-specific T cells by overexpressing the potassium channel Kv1.3 lowers [K+]i and improves effector functions in vitro and in vivo and enhances tumour clearance and survival in melanoma-bearing mice. These results uncover an ionic checkpoint that blocks T cell function in tumours and identify potential new strategies for cancer immunotherapy.


Conflict of interest statement

The authors declare no competing financial interests.

Figures
Extended Data 1
Extended Data 1. Extracellular K+ release from apoptotic and necrotic cells inhibits T cell effector function
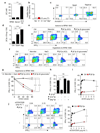
(a) Potassium concentration in TIF, RPMI, and mouse serum (b) Ratio of indicated ions in normal human tissue in comparison to serum measured on the day of tissue collection in cancer patients undergoing resection of nearby cancers originating from the same tissue type. (c) Representative flow cytometry plots of B16 melanoma tumour cells following the indicated treatment. (d) Extracellular [K+] quantification following the indicated treatment. (e,f) Representative flow cytometry plots following anti-CD3/28 stimulated CD8+ T cells cultured in isotonic or hypertonic to RPMI in the indicated conditions (g) quantification of (f). (h) Quantification of cytokine production by CD8+T cells following stimulation in the indicated conditions, elevated Ca2+ and Mg2+ conditions equal to 2mM, in comparison to 0.4 mM for control conditions. (i) Cytokine production by T cells across a titration of anti-CD3 in the indicated conditions. (j) Representative flow cytometry plots and quantification following anti-CD3/CD28 titration based activation of CD8+ T cells in the indicated conditions. Error bars represent mean ± SEM. *P < 0.05; **P< 0.01 ***P < 0.001; ****P < 0.0001 between selected relevant comparisons, 2-tailed Student’s t tests (a-d,h), 2-way ANOVA (g,i,j). (a) at least three biological replicates (b) five biological replicates (c,d) four experimental replicates (e-j) three culture replicates per condition. (c-j) Representative of at least two independent experiments.
Extended Data 2
Extended Data 2. Potassium induced T cell suppression is functionally non-redundant to CTLA-4 and PD-L1 co-inhibitory signals and is present in TIL neoantigen responses.
(a-b) IFN-γ+ of CD8+ in the indicated conditions. (c) Flow cytometry analysis of cytokine production by CD4+ T cells polarized to under (c) TH1 or (d) TH17 conditions and subsequently re-activated via immobilized anti-CD3/28 in the indicated experimental conditions. (e) Annexin V and Propidium Iodide (PI) staining following activation of primed CD8+ T cells in the indicated conditions. (f) Representative flow cytometry plots and quantification of human neo-antigen selected TIL from 3 patients stimulated in the indicated conditions with cognate mutated (mut) neo-antigen peptide pulsed _target cells (autologous B-cells). (g) Relevant somatic mutation induced neoepitope for Pts. A-C in (f). (h) Representative flow cytometry and quantification of peripheral blood leukocytes from 3 patients transduced with an HLA*A201 restricted NY-ESO-1 TCR were assayed in the indicated conditions for IFN-γ production. Additional [K+]e equal to 40 mM for (a-e) 50mM for (f,h), three culture replicates per patient per data point, representative of two independent experiments. Error bars represent mean ± SEM. *P < 0.05; **P< 0.01 ***P < 0.001; ****P < 0.0001, 2-tailed Student’s t tests (a-h). (a-h) At least three culture replicates per data point and representative of at least two independent experiments.
Extended Data 3
Extended Data 3. Elevated [K+]e acts independently of TCR induced tyrosine phosphorylation and Ca2+ to suppress serine/threonine phosphorylation within the Akt-mTOR axis.
(a) Flow cytometry analysis TCR induced Ca2+ influx in the indicated conditions (AUC = area under the curve). (b) Flow cytometry analysis of TCR induced phosphorylation of the indicated phospho-residues in primed CD8+ T cells. (c) Immunoblot analysis of phospho-tyrosine (4G10) residues from primed CD8+ T cells stimulated as above. For immunoblot source data see Supplementary Figure 1. (d) Flow cytometry analysis of CD8+ T Cells stimulated via TCR-crosslinking for the indicated phospho-residues and representative histograms at early time points. Filled grey histograms represent unstimulated cells. (e) Flow cytometry analysis of the indicated phospho-proteins in CD8+ T cells stimulated at later time points following immobilized anti-CD3 and anti-CD28 stimulation in the indicated conditions. Elevated [K+]e equal to 40mM, isotonic. Error bars represent mean ± SEM. *P < 0.05; **P< 0.01 ***P < 0.001; ****P < 0.0001 between selected relevant comparisons, 2-tailed Student’s t tests (a,b), 2-way ANOVA (d,e). (a) Three biologic replicates per condition (b,d,e) three technical replicates per data point. Representative of (a-d) three or (e) two independent experiments.
Extended Data 4
Extended Data 4. Elevated [K+]e suppression of TCR induced Akt-mTOR signalling limits activation induced nutrient consumption and T cell effector lineage commitment.
(a-b) Flow cytometry analysis of the indicated phospho-proteins in CD8+ T Cells stimulated via anti-CD3 and anti-CD28 cross-linking in the indicated conditions. (c) 2-NBDG uptake in primed CD8+ T cells induced by TCR stimulation in the indicated conditions with representative histograms and quantification. (d) Seahorse XF Bioflux analysis of CD3-28 Dynabead induced extracellular acidification (ECAR) and oxygen consumption rate (OCR) of CD8+ T cells in the indicated conditions (e) Flow cytometry analysis of CD4+ T cells polarized in the indicated experimental condition concurrently with (e) TH1, (f) TH17, or (g) iTreg cytokines. Elevated [K+]e equal to 40mM. Error bars represent mean ± SEM. *P < 0.05; **P< 0.01 ***P < 0.001; ****P < 0.0001 between selected relevant comparisons, 2-way ANOVA (a,b), 2-tailed Student’s t tests (c-g).Three technical or (c-g) culture replicates per data point. (a-g) Representative of two independent experiments.
Extended Data 5
Extended Data 5. Pharmacologic inhibition and genetic disruption of PP2A function restores T cell effector function in elevated [K+]e.
(a) Flow cytometry analysis of the indicated phospho-proteins in primed CD8+ T cells stimulated via TCR-crosslinking in the indicated conditions. (b-c) Flow cytometry analysis of CD8+ T cell IFN-γ production following immobilized anti-CD3/28 and induced stimulation in the indicated conditions (b), or among cells expressing a PP2A_DN isoform (c). (d) Ppp2r2d gene expression in the indicated populations followed by flow cytometry analysis of IFN-γ production of the same. (e) Flow cytometry analysis of IFN-γ production by CD8+ T cells expressing an Akt1-CA isoform stimulated in the indicated conditions. Error bars represent mean ± SEM. *P < 0.05; **P< 0.01 ***P < 0.001; ****P < 0.0001 between selected relevant comparisons 2-way ANOVA (a), 2-tailed Student’s t tests (b-e) where noted (a-e) additional [K+]e equal to 40mM, (a-e) three culture replicates per condition, (a-e) representative of at least two independent experiments.
Extended Data 6
Extended Data 6. Depletion of intracellular potassium restores T cell cytokine production in the presence of elevated extracellular [K+].
(a,b) Intracellular [K+] of CD8+ T cells in the indicated conditions assayed via relative fluorescence of the potassium sensitive dye Asante-Green 4. (c) Flow cytometry analysis of IFN-γ production by primed CD8+ T cells following immobilized anti-CD3/28 based activation in the indicated conditions. (d) Plasma membrane potential (Vm) of CD8+ T cells in the indicated conditions assayed with the voltage-sensitive fluorescent indicator DiSBAC4 (e) Relative intracellular [K+] of CD8+ T cells in the indicated conditions assayed with the potassium sensitive dye Asante-Green 4. (f) Pictorial representation of the resultant intracellular changes in plasma membrane potential (Vm) and intracellular potassium concentration ([K+]i) in the presence of the ionophore Valinomycin. (g) Flow cytometry analysis of CD8+ T cells following immobilized anti-CD3/28 based re-activated in the indicated conditions. (h) Plasma membrane potential (Vm) of CD8+ T cells in the indicated conditions assayed with the voltage-sensitive fluorescent indicator DiSBAC4(3) (i) Relative intracellular [K+] of CD8+ T cells in the indicated conditions assayed with the potassium sensitive dye Asante-Green 4. (j) Pictorial representation of the resultant intracellular changes in plasma membrane potential (Vm) and intracellular potassium concentration ([K+]i) in the presence of the Na+, K+ ATPase inhibitor Ouabain. (k) Flow cytometry analysis of CD8+ T cells following immobilized anti-CD3/28 based re-activated in the indicated conditions. Error bars represent mean ± SEM. *P < 0.05; **P< 0.01 ***P < 0.001; ****P < 0.0001 between selected relevant comparisons 2-tailed Student’s t tests (c,g,k). Three technical (a,b,d,e,h,i) or culture (c,g,k) replicates per data point. (a-k) Representative of at least two independent experiments.
Extended Data 7
Extended Data 7. Elevated [K+]e does not indelibly affect T cell intracellular [K+], membrane potential (Vm), or subsequent response to potassium induced suppression of effector function
(a) Flow cytometry based calibration for intracellular [K+]. For all values cells were treated with 50 µM Gramicidin in titrated doses of extracellular [K+] to provide a known intracellular [K+]. (b) Intra-experimental quantification of intracellular [K+] in control conditions and elevated extracellular [K+] as defined by calibration from (a). (c) Flow cytometry analysis of the relative plasma membrane potential (Vm) of CD8+ T cells of the indicated origin using the voltage-sensitive fluorescent indicator DiSBAC4(3) (d) cells of the indicated origin assayed in the indicated conditions as in (c). (e) Flow cytometry analysis of relative intracellular [K+] of CD8+ T cells of the noted origin washed and assayed as indicated conditions quantified by relative fluorescence of the potassium sensitive dye Asante-Green 4. (f) Compiled analysis of relative IFN-γ production by CD8+ of the indicated origin washed and subjected to TCR stimulation in the indicated conditions. Error bars represent mean ± SEM. NS, not significant, between experimental and the control condition as assayed by 2-tailed Students t test (c) or 2-way ANOVA (d-f), for chronic conditioning additional [K+]e equal to 40mM, three (a-e) technical or (f) culture replicates per condition, (a-f) representative of two independent experiments.
Extended Data 8
Extended Data 8. Enforced Kcna3 or Kcnn4 expression in CD8+ T cells augments effector function
(a) Flow cytometry analysis of CD8+ T cells retrovirally engineered with Ctrl-Thy1.1 or Kcna3-Thy1.1 encoding constructs assayed for relative intracellular [K+] quantified by relative fluorescence of the potassium sensitive dye Asante-Green 4. (b) Flow cytometry analysis of CD8+ T cells following re-activated in the indicated conditions. (c) Flow cytometry analysis of CD8+ T cells retrovirally engineering with Ctrl-Thy1.1, Kcna3-Thy1.1, or Kcnn4-Thy1.1 encoding constructs and re-activated in the indicated conditions. (d) Flow cytometry analysis of IFN-γ+ among CD8+ following re-activation in the indicated conditions (e). Flow cytometry analysis of Pmel-1 CD8+Thy1.1+ TIL IFN-γ+ production 6-8 days after transfer into tumour bearing hosts following ex vivo re-activation. (f) Pmel-1 CD8+ T cells retrovirally engineered with either Ctrl-Thy1.1 or Kcna3-Thy1.1 constructs and transferred into C57BL/6 hosts in conjunction with vv-hgp100 and quantified by cell number (f) or (g) surface phenotype found in the blood of recipients. Error bars represent mean ± SEM), 2-tailed Student’s t tests (a-d). 2-way ANOVA (f,g), NS, not significant, *P < 0.05; **P< 0.01 ***P < 0.001; ****P < 0.0001. Three (a) technical or (b-d) culture replicates per condition. (e) seven mice per group (f,g) five mice per group. (a-g) Representative of two independent experiments.
Extended Data 9
Extended Data 9. Elevated intracellular [K+] induced suppression of human CD8+ TIL effector function requires intact PP2A activity.
(a) Flow cytometry analysis of relative intracellular [K+] via the potassium sensitive fluorescent dye Asante-Green 4 of human CD8+ TIL in the indicated conditions. (b) Representative flow cytometry of the same cells in (a) following TCR based activation in the indicated conditions, quantification depicted in Fig. 4e. (c) Flow cytometry analysis of CD8+ T cells retrovirally engineered with either Ctrl-Thy1.1, Kcna3-Thy1.1, or Kcna3_PD - Thy1.1 encoding constructs. (d) Flow cytometry analysis of Thy1.1+ (transduced) Pmel-1 CD45.1+CD8+ TIL re-isolated 6 days following transfer into B16 melanoma-bearing mice and re-stimulated ex-vivo. Immunoprecipitated PP2A protein complexes isolated and assayed for relative phosphatase activity in (e) titrated concentrations of Okadaic acid or (f) the indicated conditions. Additional [K+]e equal to 40 mM for mouse cells and 50 mM for human cells unless otherwise indicated. Error bars represent mean ± SEM. NS, not significant between selected relevant comparisons, *P < 0.05; **P< 0.01 ***P < 0.001; ****P < 0.0001, 2-tailed Student’s t tests (c,f). Three (a,e,f) technical or (b,c) culture replicates per condition. (d) Five mice per group. (a-f) Representative of two independent experiments.
Extended Data 10
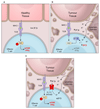
Extended Data 10. Intratumoural inhibition of T cell effector function via an ionic checkpoint.
(a) Healthy tissue contains limited local cellular decay, maintaining the interstitial [K+]e close to serum. T cells are robustly activated following TCR stimulation. (b) Tumour intrinsic phenomena produce a high density of cell death within cancers. Cell death leads to release of intracellular potassium into the extracellular space. The resultant elevated extracellular [K+] acts to increase the intracellular [K+] of T cells, limiting their activation and effector function. (c) Reduction of [K+]i and increased effector function can be imparted to tumour-specific T cells by over-expression of the potassium channel Kv1.3 (Kcna3).
Figure 1
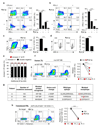
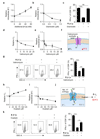
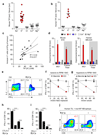
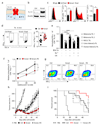
Figure 1. Elevated [K+] within tumour interstitial fluid (TIF) silences the TCR induced anti-tumour function of mouse and human T cells
(a-b) Ratiometric representation of TIF to serum values for the indicated ions from mouse (a) and human (b) tumour tissue. (c) Linear regression and 95% CI best fit line representing the relationship between TIF [K+] and Annexin V+ cells per gram of tumour. Significance calculated by Pearson’s correlation coefficient. (d) Extracellular concentration of electrolytes following induction of cell death as indicated for mouse (left) and human (right) tumour cell lines. (e-i) Anti-CD3/28 based activation of CD8+ mouse T cells in the indicated conditions with representative flow cytometry, additional [K+]e equal to 40mM unless otherwise indicated (e) and quantification (f-i). (j) Human TIL stimulated in the indicated conditions with mutated (mut) neo-antigen peptide pulsed _target cells (autologous B-cells), additional [K+]e equal to 50 mM . Error bars represent mean ± SEM. *P < 0.05; **P< 0.01 ***P < 0.001; ****P < 0.0001 between selected relevant comparisons, (f,g) 2-way ANOVA, (h,i) 2-tailed Student’s t tests. (a,c) eighteen biological replicates (b) five biological replicates (d) four culture replicates (e-i) three culture replicates per condition (j) three culture replicates. Representative of (e-g) three (h,i,j) two independent experiments.
Figure 2
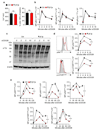
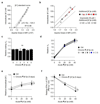
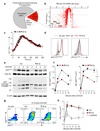
Figure 2. Extracellular potassium inhibits TCR induced transcripts and function by suppressing Akt-mTOR phosphorylation
(a) Pie chart representing proportional subpopulations of all transcripts following 2h re-stimulation of purified CD8+ T cells with anti-CD3/28 (b) Volcano plot of TCR induced genes briefly re-stimulated with anti CD3/28 in the indicated conditions. (c) TCR cross-linking induced calcium flux of CD8+ cells as measured by Fluo3 / FuraRed fluorescence in the indicated conditions. (d) Representative phosflow cytometry plots following TCR cross-linking in the indicated conditions. (e) Immunoblot analysis of the indicated phospho-residues in CD8+ T cells following TCR cross-linking (f) Quantitative phosflow analysis of cells activated as in (c) and (d) with representative flow cytometry in (g). (h) Quantification of the indicated phosphotidylinositol species in CD8+ T cells activated via TCR cross-linking in the indicated conditions. Error bars represent mean ± SEM. *P < 0.05; **P< 0.01 ***P < 0.001; ****P < 0.0001 between selected relevant comparisons, 2-way ANOVA, (c-h) where noted additional [K+]e equal to 40mM (a,b,c) three biological replicates (d,f) three technical replicates per data point (h) three experimental replicates with pooled analysis displayed, (d-g) representative of at least three independent experiments.
Figure 3
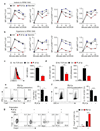
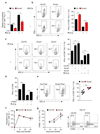
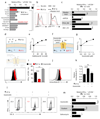
Figure 3. Extracellular potassium mediated T cell suppression requires intact PP2A activity and is associated with elevations in intracellular potassium
(a) Selected phosphatase inhibitors from a pharmacologic screen for IFN-γ production of CD8+ T cells in the presence of elevated [K+]e, depicted as the ratio of IFN-γ expression in Ctrl / elevated [K+]e conditions in the presence of indicated phosphatase inhibitors (b) CD8+ T cell phosphorylation of pAktS473 and pS6S235/6 10 minutes following TCR cross-linking in the indicated conditions. (c) Compiled analysis of IFN-γ production by retrovirally transduced CD8+ Thy1.1+ T cells following TCR stimulation in the indicated conditions. (d) Pictorial representation of the resultant intracellular changes in plasma membrane potential (Vm) and intracellular potassium concentration ([K+]i) in the presence of elevated extracellular potassium ([K+]e). (e) Relative cytoplasmic Vm of CD8+ T cells in the indicated conditions represented as relative fluorescence of the voltage-sensitive fluorescent indicator DiSBAC4(3). (f) Pictorial representation of the resultant intracellular changes in plasma membrane potential (Vm) and intracellular potassium concentration ([K+]i) in the presence of the ionophore gramicidin. (g) Relative cytoplasmic Vm of CD8+ T cells in the indicated conditions assayed as in (e) with representative flow cytometry in (h). (i) IFN-γ production by CD8+ T cells following TCR induced stimulation in the indicated conditions. (j) Representative flow cytometry representing [K+]i of CD8+ T cells as relative fluorescence of the potassium sensitive dye Asante-Green 4. (k) Relative [K+]i of CD8+ T cells in the indicated conditions assayed as relative fluorescence of the potassium sensitive dye Asante-Green 4. (l) Representative flow cytometry of cytokine expression by CD8+ T cells following TCR stimulation in the indicated conditions with compiled quantification in (m). Error bars represent mean ± SEM. *P < 0.05; **P< 0.01 ***P < 0.001; ****P < 0.0001 between selected relevant comparisons, 2-tailed Student’s t tests (a-m), where noted additional [K+]e equal to 40mM, (a,c,i,l,m) at least three culture replicates per data point (e,g,h,j,k) three technical replicates per data point, representative of at least (a,b,c,m) two or (e,g,i,h,l,k) three or greater independent experiments.
Figure 4
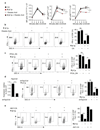
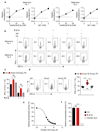
Figure 4. Kcna3 mediated augmented K+ efflux lowers intracellular [K+], enhances Akt-mTOR signalling, and augments anti-tumour effector function to improve tumour clearance and host survival.
(a) Pictorial representation of the potassium channel Kv1.3 (Kcna3) (b) Representative immunoblot analysis of Kv1.3 protein abundance in CD8+ Pmel-1 cells following retroviral transduction with Ctrl (Empty-Thy1.1) or Kcna3-Thy1.1 constructs. (c,d) Thy1.1+ Pmel-1 CD45.1+CD8+ TIL 6-8 days following transfer into B16 melanoma-bearing mice were analysed for indicated phospho-residues (c) or in vivo IFN-γ production 6 hours after injection with Brefeldin A (d). (e) Relative cytokine expression of human TIL originating from the indicated histology following TCR stimulation in the indicated conditions. (f,g) Analysis of intracellular [K+] (f) and representative flow cytometry for the expression of the indicated cytokines (g) of CD8+ Thy1.1+ T cells following transduction with retrovirus expressing Ctrl, Kcna3, or Kcna3_PD Thy1.1+ constructs. (h,i) Rates of tumour growth (h) and host survival (i) represented over time following receipt of Pmel-1 CD8+ T cells transduced as in (f,g). 2-tailed Student’s t tests (c-e), 2-way ANOVA (f), Wilcox rank-sum analysis (h), and Log-rank of Kaplan-meier survival estimates (i). Error bars represent mean ± SEM. *P < 0.05; **P< 0.01 ***P < 0.001; ****P < 0.0001 between selected relevant comparisons, additional [K+]e equal to 50mM in (e). (c) five mice per group (d) seven mice per group (e) each symbol represents the mean of three culture replicates per patient per data point (f) three technical replicates per data point (h,i) at least ten mice per group, representative of (b) three, (c-i) two independent experiments.

Comment in

Similar articles

Cited by

References

    1. Mellman I, Coukos G, Dranoff G. Cancer immunotherapy comes of age. Nature. 2011;480:480–489. doi: 10.1038/nature10673. - DOI - PMC - PubMed
    1. Richards CH, Mohammed Z, Qayyum T, Horgan PG, McMillan DC. The prognostic value of histological tumor necrosis in solid organ malignant disease: a systematic review. Future Oncol. 2011;7:1223–1235. doi: 10.2217/fon.11.99. - DOI - PubMed
    1. Li G, et al. EphB3 suppresses non-small-cell lung cancer metastasis via a PP2A/RACK1/Akt signalling complex. Nat Commun. 2012;3:667. doi: 10.1038/ncomms1675. - DOI - PubMed
    1. Zhou P, et al. In vivo discovery of immunotherapy _targets in the tumour microenvironment. Nature. 2014;506:52–57. doi: 10.1038/nature12988. - DOI - PMC - PubMed
    1. Sitkovsky M, Lukashev D. Regulation of immune cells by local-tissue oxygen tension: HIF1 alpha and adenosine receptors. Nat Rev Immunol. 2005;5:712–721. doi: 10.1038/nri1685. - DOI - PubMed

MeSH terms

  NODES
INTERN 1
Note 4
Project 1
twitter 2