Editor's Highlight: Screening ToxCast Prioritized Chemicals for PPARG Function in a Human Adipose-Derived Stem Cell Model of Adipogenesis
- PMID: 27664422
- PMCID: PMC5216650
- DOI: 10.1093/toxsci/kfw186
Editor's Highlight: Screening ToxCast Prioritized Chemicals for PPARG Function in a Human Adipose-Derived Stem Cell Model of Adipogenesis
Abstract
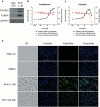
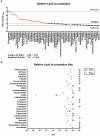
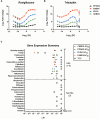
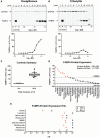
The developmental origins of obesity hypothesis posits a multifaceted contribution of factors to the fetal origins of obesity and metabolic disease. Adipocyte hyperplasia in gestation and early childhood may result in predisposition for obesity later in life. Rodent in vitro and in vivo studies indicate that some chemicals may directly affect adipose progenitor cell differentiation, but the human relevance of these findings is unclear. The nuclear receptor peroxisome proliferator-activated receptor gamma (PPARG) is the master regulator of adipogenesis. Human adipose-derived stem cells (hASC) isolated from adipose tissue express endogenous isoforms of PPARG and represent a biologically relevant cell-type for evaluating activity of PPARG ligands. Here, a multi-endpoint approach based on a phenotypic adipogenesis assay was applied to screen a set of 60 chemical compounds identified in ToxCast Phase I as PPARG active (49) or inactive (11). Chemicals showing activity in the adipogenesis screen were further evaluated in a series of 4 orthogonal assays representing 7 different key events in PPARG-dependent adipogenesis, including gene transcription, protein expression, and adipokine secretion. An siRNA screen was also used to evaluate PPARG-dependence of the adipogenesis phenotype. A universal concentration-response design enabled inter-assay comparability and implementation of a weight-of-evidence approach for bioactivity classification. Collectively, a total of 14/49 (29%) prioritized chemicals were identified with moderate-to-strong activity for human adipogenesis. These results provide the first integrated screening approach of prioritized ToxCast chemicals in a human stem cell model of adipogenesis and provide insight into the capacity of PPARG-activating chemicals to modulate early life programming of adipose tissue.
Keywords: PPARG; ToxCast; adipogenesis; adipose-derived stem cell; endocrine disrupting chemicals; obesogens.
© The Author 2016. Published by Oxford University Press on behalf of the Society of Toxicology.
Figures



Similar articles
-
An in vitro approach for prioritization and evaluation of chemical effects on glucocorticoid receptor mediated adipogenesis.Toxicol Appl Pharmacol. 2018 Sep 15;355:112-126. doi: 10.1016/j.taap.2018.05.016. Epub 2018 May 19. Toxicol Appl Pharmacol. 2018. PMID: 29782964
-
MicroRNA-27a/b-3p and PPARG regulate SCAMP3 through a feed-forward loop during adipogenesis.Sci Rep. 2019 Sep 25;9(1):13891. doi: 10.1038/s41598-019-50210-3. Sci Rep. 2019. PMID: 31554889 Free PMC article.
-
Epigenetic programming of adipose-derived stem cells in low birthweight individuals.Diabetologia. 2016 Dec;59(12):2664-2673. doi: 10.1007/s00125-016-4099-9. Epub 2016 Sep 14. Diabetologia. 2016. PMID: 27627980
-
The Role of Peroxisome Proliferator-Activated Receptor Gamma (PPARG) in Adipogenesis: Applying Knowledge from the Fish Aquaculture Industry to Biomedical Research.Front Endocrinol (Lausanne). 2017 May 22;8:102. doi: 10.3389/fendo.2017.00102. eCollection 2017. Front Endocrinol (Lausanne). 2017. PMID: 28588550 Free PMC article. Review.
-
Environmental obesogens: organotins and endocrine disruption via nuclear receptor signaling.Endocrinology. 2006 Jun;147(6 Suppl):S50-5. doi: 10.1210/en.2005-1129. Epub 2006 May 11. Endocrinology. 2006. PMID: 16690801 Review.
Cited by
-
Identifying adipogenic chemicals: Disparate effects in 3T3-L1, OP9 and primary mesenchymal multipotent cell models.Toxicol In Vitro. 2020 Sep;67:104904. doi: 10.1016/j.tiv.2020.104904. Epub 2020 May 28. Toxicol In Vitro. 2020. PMID: 32473317 Free PMC article.
-
Characterization of Adipogenic Activity of House Dust Extracts and Semi-Volatile Indoor Contaminants in 3T3-L1 Cells.Environ Sci Technol. 2017 Aug 1;51(15):8735-8745. doi: 10.1021/acs.est.7b01788. Epub 2017 Jul 12. Environ Sci Technol. 2017. PMID: 28699343 Free PMC article.
-
Addressing chemically-induced obesogenic metabolic disruption: selection of chemicals for in vitro human PPARα, PPARγ transactivation, and adipogenesis test methods.Front Endocrinol (Lausanne). 2024 Jul 8;15:1401120. doi: 10.3389/fendo.2024.1401120. eCollection 2024. Front Endocrinol (Lausanne). 2024. PMID: 39040675 Free PMC article. Review.
-
Development of a reference and proficiency chemical list for human steatosis endpoints in vitro.Front Endocrinol (Lausanne). 2023 Apr 24;14:1126880. doi: 10.3389/fendo.2023.1126880. eCollection 2023. Front Endocrinol (Lausanne). 2023. PMID: 37168981 Free PMC article. Review.
-
Transgenerational effects of obesogens.Basic Clin Pharmacol Toxicol. 2019 Aug;125 Suppl 3(Suppl 3):44-57. doi: 10.1111/bcpt.13214. Epub 2019 Apr 10. Basic Clin Pharmacol Toxicol. 2019. PMID: 30801972 Free PMC article. Review.
References
-
- Auboeuf D., Rieusset J., Fajas L., Vallier P., Frering V., Riou J. P., Staels B., Auwerx J., Laville M., Vidal H. (1997). Tissue distribution and quantification of the expression of mRNAs of peroxisome proliferator-activated receptors and liver X receptor-alpha in humans: no alteration in adipose tissue of obese and NIDDM patients. Diabetes 46, 1319–1327. - PubMed
-
- Browne P., Judson R. S., Casey W. M., Kleinstreuer N. C., Thomas R. S. (2015). Screening chemicals for estrogen receptor bioactivity using a computational model. Environ. Sci. Technol. 49, 8804–8814. - PubMed
-
- Brun R. P., Tontonoz P., Forman B. M., Ellis R., Chen J., Evans R. M., Spiegelman B. M. (1996). Differential activation of adipogenesis by multiple PPAR isoforms. Genes Dev. 10, 974–984. - PubMed
-
- Butler E. G., Tanaka T., Ichida T., Maruyama H., Leber A. P., Williams G. M. (1988). Induction of hepatic peroxisome proliferation in mice by lactofen, a diphenyl ether herbicide. Toxicol. Appl. Pharmacol. 93, 72–80. - PubMed
MeSH terms
Substances
LinkOut - more resources
Full Text Sources
Other Literature Sources
Medical

