Phenylethanoid Glycosides from Cistanche tubulosa Inhibits the Growth of B16-F10 Cells both in Vitro and in Vivo by Induction of Apoptosis via Mitochondria-dependent Pathway
- PMID: 27698928
- PMCID: PMC5039372
- DOI: 10.7150/jca.15512
Phenylethanoid Glycosides from Cistanche tubulosa Inhibits the Growth of B16-F10 Cells both in Vitro and in Vivo by Induction of Apoptosis via Mitochondria-dependent Pathway
Abstract
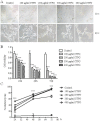
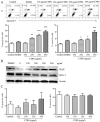
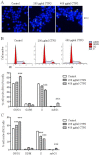
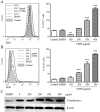
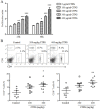
Cistanche tubulosa phenylethanoid glycosides (CTPG) have been shown various biological activities including anti-allergy, hepatoprotective activity and bone regeneration. However, the anti-tumor activity of CTPG needs to be investigated. CTPG was used to treat B16-F10 cells both in vitro and in vivo. We found that CTPG dramatically changed the morphology of B16-F10 cells, and significantly reduced the viability of B16-F10 cells in a dose-dependent and time-dependent manner, which might be mediated by CTPG-induced apoptosis and cell cycle arrest. After CTPG treatment, the expressions of BAX and BCL-2 were up-regulated and down-regulated, respectively. Moreover, mitochondrial membrane potential was reduced and ROS generation was increased. Consequently, the levels of cytochrome c and cleaved-caspase-3 and -9 were up-regulated by CTPG treatment but not for cleaved-caspase-8. We further observed that CTPG significantly inhibited the tumor growth in vivo and improved the survival rate of tumor mice. We also observed that CTPG promoted the proliferation of splenocytes and increased the proportions of CD4+ and CD8+ T cells in spleens of tumor mice. The results showed that CTPG induced the apoptosis of B16-F10 cells through mitochondria-dependent pathway, suggesting that CTPG could be a potential candidate for treatment of cancer.
Keywords: B16-F10 cell apoptosis; Cistanche tubulosa phenylethanoid glycosides; ROS; cytochrome c; mitochondria-dependent pathway..
Conflict of interest statement
All authors declare that they have no conflict of interests.
Figures


Similar articles
-
Cistanche tubulosa phenylethanoid glycosides induce apoptosis in Eca-109 cells via the mitochondria-dependent pathway.Oncol Lett. 2019 Jan;17(1):303-313. doi: 10.3892/ol.2018.9635. Epub 2018 Oct 29. Oncol Lett. 2019. PMID: 30655768 Free PMC article.
-
Cistanche tubulosa phenylethanoid glycosides suppressed adipogenesis in 3T3-L1 adipocytes and improved obesity and insulin resistance in high-fat diet induced obese mice.BMC Complement Med Ther. 2022 Oct 13;22(1):270. doi: 10.1186/s12906-022-03743-6. BMC Complement Med Ther. 2022. PMID: 36229811 Free PMC article.
-
Cistanche tubulosa Phenylethanoid Glycosides Induce Apoptosis of Hepatocellular Carcinoma Cells by Mitochondria-Dependent and MAPK Pathways and Enhance Antitumor Effect through Combination with Cisplatin.Integr Cancer Ther. 2021 Jan-Dec;20:15347354211013085. doi: 10.1177/15347354211013085. Integr Cancer Ther. 2021. PMID: 33949239 Free PMC article.
-
Cistanche tubulosa phenylethanoid glycosides induce apoptosis in H22 hepatocellular carcinoma cells through both extrinsic and intrinsic signaling pathways.BMC Complement Altern Med. 2018 Oct 12;18(1):275. doi: 10.1186/s12906-018-2201-1. BMC Complement Altern Med. 2018. PMID: 30314494 Free PMC article.
-
A Review of Biologically Active Natural Products from a Desert Plant Cistanche tubulosa.Chem Pharm Bull (Tokyo). 2019;67(7):675-689. doi: 10.1248/cpb.c19-00008. Chem Pharm Bull (Tokyo). 2019. PMID: 31257323 Review.
Cited by
-
Cistanche tubulosa phenylethanoid glycosides induce apoptosis in Eca-109 cells via the mitochondria-dependent pathway.Oncol Lett. 2019 Jan;17(1):303-313. doi: 10.3892/ol.2018.9635. Epub 2018 Oct 29. Oncol Lett. 2019. PMID: 30655768 Free PMC article.
-
Cistanche tubulosa phenylethanoid glycosides suppressed adipogenesis in 3T3-L1 adipocytes and improved obesity and insulin resistance in high-fat diet induced obese mice.BMC Complement Med Ther. 2022 Oct 13;22(1):270. doi: 10.1186/s12906-022-03743-6. BMC Complement Med Ther. 2022. PMID: 36229811 Free PMC article.
-
Effect of Cistanche Tubulosa Extracts on Male Reproductive Function in Streptozotocin⁻Nicotinamide-Induced Diabetic Rats.Nutrients. 2018 Oct 22;10(10):1562. doi: 10.3390/nu10101562. Nutrients. 2018. PMID: 30360409 Free PMC article.
-
Effect of PhenylEthanol Glycosides from Cistanche Tubulosa on Autophagy and Apoptosis in H22 Tumor-Bearing Mice.Evid Based Complement Alternat Med. 2022 Dec 9;2022:3993445. doi: 10.1155/2022/3993445. eCollection 2022. Evid Based Complement Alternat Med. 2022. PMID: 36532852 Free PMC article.
-
Traditional Chinese Medicine Combined With Chemotherapy and Cetuximab or Bevacizumab for Metastatic Colorectal Cancer: A Randomized, Double-Blind, Placebo-Controlled Clinical Trial.Front Pharmacol. 2020 Apr 21;11:478. doi: 10.3389/fphar.2020.00478. eCollection 2020. Front Pharmacol. 2020. PMID: 32372960 Free PMC article.
References
-
- Siegel R, Ma J, Zou Z, Jemal A. Cancer statistics, 2014. CA: a cancer journal for clinicians. 2014;64:9–29. - PubMed
LinkOut - more resources
Full Text Sources
Other Literature Sources
Research Materials
Miscellaneous

